Hey there guys, Hanover. Perhaps you will find the discussion in this thread http://www.forexfactory.com/showthre...=481576&page=2 interesting/worth a read. I'd appreciate your input/comments if you have the time & are so inclined.
Perhaps you will find the discussion in this thread..... interesting/worth a read. I'd appreciate your input/comments if you have the time & are so inclined.
Ignored
Thanks for your post. Not sure which idea you're specifically referring to, there are a lot of different ideas and programming requests in the thread. However, I noticed that you were asking about alerts being added to the CCFp indicator.
I intentionally didn't add alerts to PSA because the values it displays, in isolation for a given currency or pair, are essentially meaningless. For example, if USDJPY goes from 1700 to 1800, it doesn't necessarily mean that the pair is now trending more strongly upward than it was previously, it means that it's trending more strongly relative to the other pairs that it's being compared with, if their values remain unchanged. Or alternatively, if USDJPY has a value of 1800, and GBPUSD a value of 1200, then USDJPY is trending upward more strongly than GBPUSD. Hence I didn't see an alert, caused by a value crossing above or below a specified threshold for the same pair, as being meaningful. Secondly, these values' meaning is further limited by the fact that they can change significantly depending on what settings you use. Thirdly, I don't consider a 'trend' to be valid unless there is some fundamental/sentiment based reason behind it, i.e. it could otherwise simply be a 'random' move that doesn't have any real bearing on the strength of that country's economy, and therefore less likely to be sustained. Obviously the indicator has no access to this kind of data.
Much the same logic applies to the RS indy (which plots a squiggly curve, and hence is more like the CCFp indy). The RS indy's plots get re-scaled to fit a 0...100 interval, making their absolute values somewhat meaningless. I did write an add-on module 'RS Alerts', but I forget how it works now; please feel welcome to read the details in the thread, if you wish.
What I included in each one of the PSA, CSM and RS indicators, was the option of an export file. Every time the display gets updated, all relevant data values also get output to this file. These file(s) can then potentially be read by another indicator or EA, to display whatever you wish, generate alerts, or become part of the decision making in a specific trading strategy. In the case of the RS indy, Steve Hopwood wrote an EA (here) and I provided a code fragment that loads the values into arrays from which they can directly be accessed (more info and links here). In this way, the indicators can be used open-endedly and in any way that the trader/programmer wishes.
Nowadays, I use these indicators merely to give me an rough idea of relative strength/weakness, i.e. I don't use the values that they display in a calculated or mechanical way.
@Hanover.
I have an EA that makes decisions based on strength values picked from the .csv file in MQL4>Files>PSA folder.
However, I realise that there's a lag between the indicator values on the chart and the .csv values.
Even with Refresh period set to T, there's a reasonable lag.
____
If my query makes sense, is there a way to go around it?
Thank you.
I have an EA that makes decisions based on strength values picked from the .csv file in MQL4>Files>PSA folder. However, I realise that there's a lag between the indicator values on the chart and the .csv values. Even with Refresh period set to T, there's a reasonable lag.......
is there a way to go around it?
Ignored
Wow, I'm pleased that somebody is actually using this feature!
Apart from the fact that the PSA can potentially perform complex regression calculations (the number of which depends on your parameter settings), I don't know why there would be a lag. The output file should contain the updated values, and be closed ready to be read by the EA, on the next price tick.
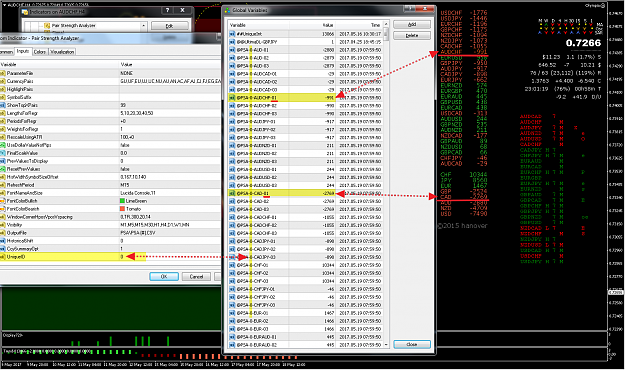
Some of the EAs that I've written trade based on PSA-generated strength values. They obtain these values from the Global Variables maintained by PSA, instead of from the file. You could also try this approach. The GVs get updated instantly, and should be immediately available to your EA.
To see the GVs as shown in the screenshot below, press F3.
To retrieve the values for your EA, use something like:
where UniqueID matches the UniqueID setting used in the PSA (see screenshot)
and SymbolID is the ID of the instrument/pair whose PSA value you require.
Lag doesn't affect me as I use PSA only on longer TFs, where values change infrequently.
I can't promise that using the GVs will reduce the lag, but it might be worth a try. Good luck.
{quote} there are plenty of csm right here on ff if you take the the time and make the effort to find them and pm is probably the best way to ask, just saying {image}
{quote} Wow, I'm pleased that somebody is actually using this feature!
Ignored
Thank you for your elaborative reply Chief!
I am not a coder myself, the EA is being coded by one of the senior coders here on FF.
Somehow, he fixed something and i nolonger see the issue.
Working flawlessly.
____
Again, thanks for a great tool.
Am I too late to have this beautifull indicator? when attaching it to my chart it does allow me to change the inputs and on the right side of the screen i see PSA(c)2015 Hanover but other than that nothing.
With the Recent Strenght Indicator it doesn't even give me the possibilty to change the settings.
Anybody can point me in the right direction to make this work?
Am I too late to have this beautifull indicator? when attaching it to my chart it does allow me to change the inputs and on the right side of the screen i see PSA(c)2015 but other than that nothing......... Anybody can point me in the right direction to make this work?
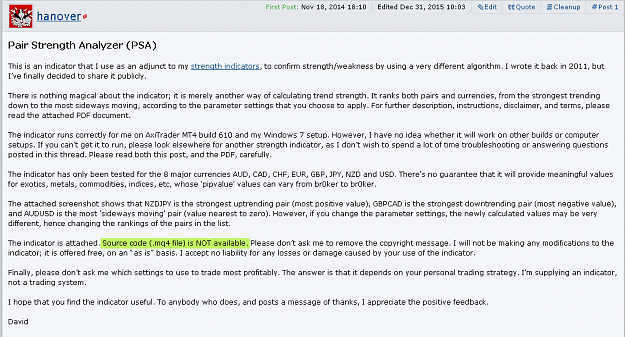
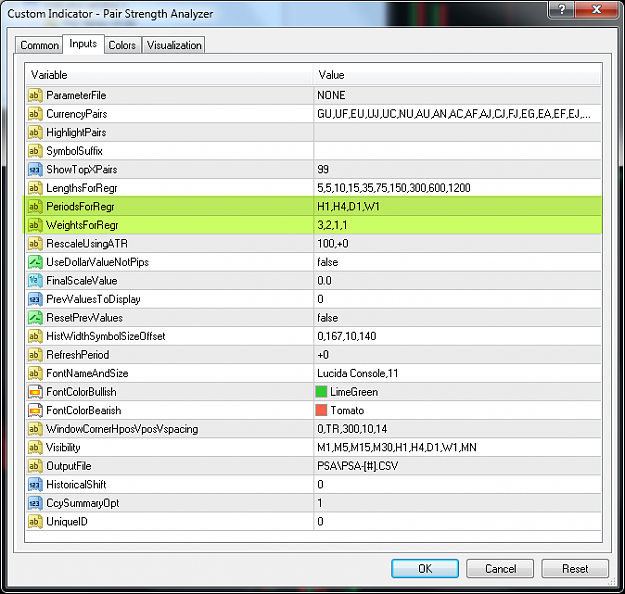
I'm running Pepperstone MT4 build 1090. I changed the settings highlighted in green, attached it to my chart, and got the result shown in the screenshot:
Attached Image (click to enlarge)
If you have the MQ4 file, you might need to delete it, as it compiles with errors in the latest builds.
Hence use the attached EX4 file only; download it into the ..../MQL4/Indicators folder. Then restart MT4, and re-attach the indicator to your chart.
Good luck.
I've tried it changing the inputs like in your screenshot, I tried it on Windows 10 and Windows 2012 Server R2. Im using Tradersway MT4 build 1090.
Ignored
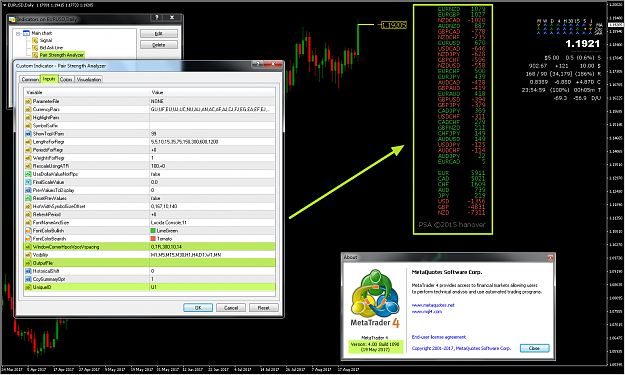
Your computer setup must differ from mine somehow, but I can't guess what difference might be causing the problem. I'm running Windows 7 Home Premium Service Pack 1, and using the same EX4 file that I attached to post #193.
Perhaps it is a data problem. You could try cutting the number of CurrencyPairs back to maybe just 3 or 4 major pairs, and see what happens. Maybe the indicator can't locate the necessary data for all 28 pairs. You could also simplify further by cutting back the number LengthsForRegr entries, and eliminating the ATR scaling. See attached screenshot.
Sorry, but apart from that I don't know what else to try. There are links to lots of other strength indicators in the green typeface of post #1 here. Hopefully one of those will work for you. Good luck.
Please excuse me for having been an idiot. I pretty much tried changing every input except changing the suffix. Tradersway uses the suffix I. Thanks for all your patience and help.
The indicator is already MTF in the sense that you can specify whatever TF you want to use as the basis for the regression lines to be calculated, i.e. using the PeriodsForRegr parameter.
It also goes beyond MTF in at least three additional ways:
1. PeriodsForRegr allows you to specify the TF in either relative or absolute terms (usage explained below**). If absolute, the calculation remains locked to the TF you specify, even if you change the chart TF. If relative, the calculation changes along with the TF of the chart.
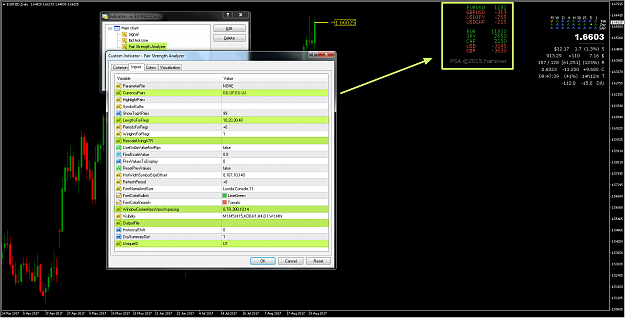
2. PeriodsForRegr optionally allows you to specify multiple TFs (separated by commas), and then WeightsForRegr further allows you to assign an arbitrary weight to each TF, respectively. The indicator then combines all of these calculations to give a consolidated result.
Example: in the screenshot below, the H1 regression values would all get multiplied by 3, the H4 values by 2, the D1 and W1 values each by 1, and then they are all combined together to give the final result -- in other words, the slopes of 40 regression lines would be averaged: 10 LengthsForRegr lines (lengths 5,5,10,15,35,75,150,300,600,1200) across each of 4 different TFs (PeriodsForRegr), and all repeated to give a consolidated result for each currency pair in CurrencyPairs.
3. In addition to points 1 and 2, and provided that you give each instance of the indicator a different UniqueID parameter value, you can attach multiple instances of the indicator to the same chart. For example, you could display separate hourly, daily, weekly etc values on the same chart, using whatever regression calculations you wish.
For more detailed info, please read the instruction PDF attached to post #1.
[** Relative and absolute timeframes:
Absolute TF: you may enter the TF as any of: M1, M5, M15, M30, H1, H4, D1, W1, MN
OR
Relative TF: +0 = the TF of the current chart, +1 = the next longer TF, -1 = the next shorter TF, etc. For example, if the current chart is H4, then +0 = H4, +1 = D1, +2 = W1, etc; -1 = H1, -2 = M30, etc. ]
Is there a setting where it will list the pairs strength from most positive to most negative. Basically, separate the positive and the negative so it'll be easier and faster to trade. thank you so much!