• Home
  • Forums
  • Trades
  • News
  • Calendar
  • Market
  • Brokers
  • Login
  • Join
  • User/Email: Password:
  • 3:04pm
Menu
  • Forums
  • Trades
  • News
  • Calendar
  • Market
  • Brokers
  • Login
  • Join
  • 3:04pm
Sister Sites
  • Metals Mine
  • Energy EXCH
  • Crypto Craft

Options

Bookmark Thread

First Page First Unread Last Page Last Post

Printable Version

Similar Threads

The 4 Hour Fozzy Method 233 replies

FOZZY Method CROSSES 808 replies

Fozzy Alt... one more approach to the Daily Fozzy Method 40 replies

My Daily Fozzy Trades 337 replies

Monthly Fozzy Method 9 replies

  • Trading Systems
  • /
  • Reply to Thread
  • Subscribe
  • 343
Attachments: The Daily Fozzy Method
Exit Attachments

The Daily Fozzy Method

  • Last Post
  •  
  • Page 1 23456 141
  • Page 1 2 141
  •  
  • Opened Nov 21, 2006 | Closed to Voting | 102 Votes
  • Poll Results
Should we start a new thread devoted to modified "fozzy" trading?  
Yes 74 Votes
73%
No 28 Votes
27%
  • Post #1
  • Quote
  • First Post: Sep 13, 2006 1:52am Sep 13, 2006 1:52am
  •  fozzy
  • | Joined Apr 2005 | Status: Member | 62 Posts
This is my first post on FF after months of reading and trying some of the numerous systems provided by members of this forum. Months ago I came across the following indicators that were posted on one of the Vegas threads. I cannot remember who posted it but I am extremely grateful for their insight and hope they do not mind if I show my way of using this indicator.

After months of testing and swapping from system to system I've come back to this indicator and in hindsight I should have stuck with it from the start as it seems to work for my style of trading.

Anyway, on with the detail. I only trade daily charts and only EUR/USD, GBP/USD, USD/JPY and USD/CHF. Why these? Primarily because these are the only ones I have backtested and have been trading for the last 3 months. I also tend not to trade Monday mornings (Australian time) as prices sometimes gap over the weekend. However, this is discretionary.

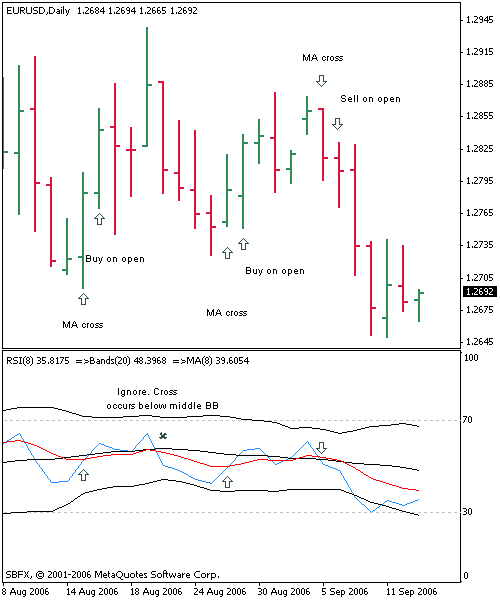
On each chart I have an 8 period RSI. I also have an 8 period MA of the RSI and Bollinger Bands with a 20 period setting, also on the RSI.

Long Entries: RSI must be below the middle Bollinger Band. Enter long on the open of the next bar after the MA has crossed above the RSI.
Short entries: RSI must be above the middle Bollinger Band. Enter when MA crosses below RSI.

Stop loss is the low/high of the previous bar. I move S/L to break even if the price moves greater than 40 pips in my direction. After the initial 40 pip move I use a trailing stop for exits (25 pips).

I only look at the charts once per day, just before 0.00 GMT. This way I know which pairs are approaching my set-up. I then place trades if my criteria has been met. That's it. A simple system that seems to work for me. Looking at charts all day does not suit me as I have a real job and I'm not in a convenient timezone. 10 minutes a day is all I need. This method provides a limited number of trades but the trades can last anywhere from 1 day to numerous days. There can also be days on end with no trades. I have found that the secret is have patience. I also have come to believe those who say longer timeframes are easier, especially for newbies.

I'm not going to say this system will always work but for me it has generated over 400 pips in September already. Please try this out on demos before putting your hard-earned into it. Just because it is working for me (at the moment) does not mean it will suit everyone.

Please feel free to comment.
Attached Image
File Type: bmp daily eur.usd.bmp   879 KB | 63,332 downloads
  • Post #2
  • Quote
  • Sep 13, 2006 2:25am Sep 13, 2006 2:25am
  •  minute
  • | Joined Jun 2006 | Status: Member | 399 Posts
Congrats on your first post.

Great you have worked out your own system! I think this helps by making it your own. You may come back to other stuff but I really think it's important to own it.

As far as the workability goes, I'm not qualified to evaluate, but it looks as good as any. My mandate is - if it works for you then it works.

good to see another aussie forex nut here!
:waiting:
  • Post #3
  • Quote
  • Sep 13, 2006 3:30am Sep 13, 2006 3:30am
  •  warpats
  • | Joined Aug 2006 | Status: Member | 5 Posts
Thx for the sharing. I'm still new to Metatrader, sorry to question it at here, may I know how to combine all the 3 indicator in 1 column, THX.
  • Post #4
  • Quote
  • Sep 13, 2006 4:16am Sep 13, 2006 4:16am
  •  minute
  • | Joined Jun 2006 | Status: Member | 399 Posts
Quoting warpats
Disliked
Thx for the sharing. I'm still new to Metatrader, sorry to question it at here, may I know how to combine all the 3 indicator in 1 column, THX.
Ignored
First set RSI as usual, then drag MA from navigator window into the window of the RSI. Then select apply to first indicators data.

Repeat for bollinger bands.
:waiting:
  • Post #5
  • Quote
  • Sep 13, 2006 10:28am Sep 13, 2006 10:28am
  •  fxshizzle
  • | Joined May 2006 | Status: Member | 8 Posts
Looks like an interesting way to profit from ranging daily pairs.
  • Post #6
  • Quote
  • Sep 13, 2006 10:59am Sep 13, 2006 10:59am
  •  accrete
  • Joined Jan 2006 | Status: Pips Ahoy! | 1,130 Posts
Well i don't know if maybe this post of mine from waaay back in January of this year had any part in planting a seed, but if it did i am doubly blessed that somehow it has become something you found useful in your trading plan and goals.

I went ahead and did a copy/paste as some of it might help along the lines of why and how i came to using these indicators myself, and how to also do some simple mods to the RSI to help with the visuals. The lower most image shows the RSI in use with the RSI-Dots also looking for the V and inverted-V for possible reversal signs.

Cheers,
Thom

Quoting accrete
Disliked
Part of this is something i just posted in another area (the idea of using an RSI+MA as a possible reversal indicator), but it is also applicable to switching your FIBO take-profit lines to dots-per-candle which i like, as I also changed my FIBO lines to dots on my Knife and VWB Daily Take-Profit FIBOs:

http://www.accrete.com/fx_posts/J13G...24vwb-dots.PNG

...and here is a screen shot of my knife set up w/dots instead of lines at my Take-Profit FIBOs:
http://www.accrete.com/fx_posts/J13G...knife-dots.PNG

Check out this screen shot i took this am (jan 24th) of EUR/USD pair (red lines/arrows are my additions for this example):

http://www.accrete.com/fx_posts/J13G...01-24rsibb.PNG

Here is what eye-see. I've been using this indicator on my "other" charts for several months. The idea of having an indicator inside bollinger bands was introduced to me while reading John Bollinger's "Bollinger on Bollinger Bands" book. I then added a matching period sma. You can see that the indicator clearly showed the reversal. Seeing the reversal is not a problem w/this setup...KNOWING how FAR the reversal will go? Well that's up to the Lady with the crystal ball ; - )

Here is how you set this up in MT4:

1) Start with a fresh chart of your choice

2) Apply an RSI and set for whatever period you wish (the above is set at 8, i have several FX friends who trade using the 9...i just happen to like FIBO #s )

Here is how you set this up in MT4:


1) Start with a fresh chart of your choice


2) Apply an RSI and set for whatever period you wish (the above is set at 8, i have several FX friends who trade using the 9...i just happen to like FIBO #s )


3) Apply "Bollinger Bands" to the indicator's window (i.e. drag the BB into the RSI indicator window


4) Under "Apply to" set to "First Indicator's Data" other wise the BBs will show up on the chart window.


5) Apply a "Moving Average" and set the Period to same period you have set the RSI, and also do step #4

6) Now before you do anything else, save this as a template...something simple like RSI inside BB's ??

There you have it. I like this indicator for an exit indicator. When the RSI line (Aqua in my example) crosses over the (magenta) SMA i exit a portion of my trade, if not all of it.

OK, NOW IF YOU WANT TO ADD THE DOTS which are drawn at each candle-rsi reading:
I'm doing this in a seperate step because some will not want the dots on the line. Here is my reasoning for having them. I like the visuals that the dots give me in the form of "V"s and upside down "V"s. The dots just define the move for my eye.

If you wish to have them on your RSI follow all the above. THEN, place go to the RSI in the custom indicator folder and click "Modify". First thing to do is a "save as" something like "rsi dots"?? Then "Complile" it and it will show up in the "Custom Indicator" list. Now apply it to the chart by dragging it into the same window as the current RSI. You won't see anything different if you have it set to the same period.

Now you change some code:

Find this area on your code:

//---- indicator line
SetIndexStyle(0,DRAW_LINE);
SetIndexBuffer(0,RSIBuffer);
//---- name for DataWindow and indicator subwindow label

...then change it to read:

//---- indicator line
SetIndexStyle(0,DRAW_ARROW,EMPTY);
SetIndexArrow(0,115);
SetIndexBuffer(0,RSIBuffer);
//---- name for DataWindow and indicator subwindow label

Go ahead and hit "compile" again and the dots should show up on the chart indicator.

Now save that template again and you are set for next time you wish to apply this indicator to another chart.

Hope this helps, have fun tweaking the periods.

================for Knife, look for " //---- indicators " area and change to the following:

//---- indicators
SetIndexStyle(0,DRAW_LINE,STYLE_SOLID,2);
SetIndexBuffer(0,ExtMapBuffer1);
SetIndexLabel(0,MicroSMA + " MA");
SetIndexStyle(1,DRAW_LINE);
SetIndexBuffer(1,ExtMapBuffer2);
SetIndexLabel(1,MicroFMA + " MA");
SetIndexStyle(2,DRAW_ARROW,EMPTY);
SetIndexArrow(2,115);
SetIndexBuffer(2,ExtMapBuffer3);
SetIndexStyle(3,DRAW_ARROW,EMPTY);
SetIndexArrow(3,115);
SetIndexBuffer(3,ExtMapBuffer4);
SetIndexStyle(4,DRAW_ARROW,EMPTY);
SetIndexArrow(4,115);
SetIndexBuffer(4,ExtMapBuffer5);
SetIndexStyle(5,DRAW_ARROW,EMPTY);
SetIndexArrow(5,115);
SetIndexBuffer(5,ExtMapBuffer6);
// SetIndexStyle(6,DRAW_LINE,STYLE_DOT,1,Green);

================for Vegas Daily Currency, look for " //---- indicators " area and change to the following:

//---- indicators
SetIndexStyle(0,DRAW_LINE);
SetIndexBuffer(0,ExtMapBuffer1);
SetIndexStyle(1,DRAW_LINE,STYLE_SOLID,3);
SetIndexBuffer(1,ExtMapBuffer2);
SetIndexStyle(2,DRAW_ARROW,EMPTY);
SetIndexArrow(2,115);
SetIndexBuffer(2,ExtMapBuffer3);
SetIndexStyle(3,DRAW_ARROW,EMPTY);
SetIndexArrow(3,115);
SetIndexBuffer(3,ExtMapBuffer4);
SetIndexStyle(4,DRAW_ARROW,EMPTY);
SetIndexArrow(4,115);
SetIndexBuffer(4,ExtMapBuffer5);
SetIndexStyle(5,DRAW_ARROW,EMPTY);
SetIndexArrow(5,115);
SetIndexBuffer(5,ExtMapBuffer6);
SetIndexStyle(6,DRAW_ARROW,EMPTY);
SetIndexArrow(6,115);
SetIndexBuffer(6,ExtMapBuffer7);
SetIndexStyle(7,DRAW_ARROW,EMPTY);
SetIndexArrow(7,115);
SetIndexBuffer(7,ExtMapBuffer8);
//----
Ignored
  • Post #7
  • Quote
  • Sep 13, 2006 11:16am Sep 13, 2006 11:16am
  •  forextrader81
  • | Joined Apr 2006 | Status: Member | 13 Posts
Thanks for sharing your method. I think I am seeing this differently. I was looking at the daily charts and when RSI crosses MA which is below the middle band to the upside it is a long entry and vice versa for the short. Is that what you meant or is it MA crossing the RSI to the upside? I see the RSI crossing the MA as a long signal. Let me know what you think.

Thanks
  • Post #8
  • Quote
  • Sep 13, 2006 11:59am Sep 13, 2006 11:59am
  •  JBB
  • | Joined Jul 2006 | Status: Member | 75 Posts
Hi Fozzy.
Thank you for sharing. Do you use EMA or SMA?

Question for MT4 users. When adding an indicator, in "Apply to" window there are two options: "to first indicator data" and "to previous indicator data". Which one to choose? Does it make any difference?

Thank you
  • Post #9
  • Quote
  • Sep 13, 2006 1:10pm Sep 13, 2006 1:10pm
  •  accrete
  • Joined Jan 2006 | Status: Pips Ahoy! | 1,130 Posts
Some years ago there was a father/son team (Bollinger mentions them in his books) that did some work on changing the BB's to EMA instead of SMA and touted it as the next mouse trap...it died out apparently over time and the Simple Moving Averages to this day on the BB's do well. Typicaly one would match up the RSI signal line (which is what the 8 MA is) with a SMA, but experiment. You ain't gonna break anything : ) I use the SMA on the 8 mainly due to Bollinger's use of the SMAs in his BBs that have been placed as an envelope around this RSI in this model.

====JBB, If you have only one indicator in the window (in our case the RSI, the "First" should do the trick.)

: ) Thom
  • Post #10
  • Quote
  • Sep 13, 2006 2:40pm Sep 13, 2006 2:40pm
  •  SpecialK
  • | Joined May 2006 | Status: Member | 9 Posts
I'm having trouble moving (dragging) any indicator from the main chart to an indicator window below the main chart. I've seen the drag comment. I've seen comments about the "Apply to" menu. Whenever I right click on a indicator from the navigator, the only options I get are: Attach to Chart, Add to favorites, and Set Hotkey.

Perhaps I have some settings wrong in my MT4...

Any help?
  • Post #11
  • Quote
  • Sep 13, 2006 3:29pm Sep 13, 2006 3:29pm
  •  sam1
  • | Joined Jul 2006 | Status: Member | 44 Posts
SpecialK, I'll walk you thru it. Open a RSI indicator, then click the navigator tab. Left click (not right click) and hold then drag the "moving average" to the chart window. Release your finger from the left click, a typical indicator window will pop up. On the "apply to" field, choose "first indicator data". That's it!

My question is... why is my bollinger band too squeezy? I set 20 period to it (BB).
  • Post #12
  • Quote
  • Sep 13, 2006 3:41pm Sep 13, 2006 3:41pm
  •  SpecialK
  • | Joined May 2006 | Status: Member | 9 Posts
Thanks much Sam, I finally found that apply thing on the menu. I had only used to box to apply things to close or h/l/c, I had no idea that was the place to load the chart onto the indicator window. Learn something everyday.
  • Post #13
  • Quote
  • Sep 13, 2006 7:16pm Sep 13, 2006 7:16pm
  •  HAGeek
  • | Joined Jul 2006 | Status: Member | 84 Posts
looks very interesting..

have you tried trading with 2 lots. 1st lot TP at 50pips. 2nd lot trailing 50pips?

looks pretty good on those 4 pairs in last month or so.
  • Post #14
  • Quote
  • Sep 13, 2006 7:31pm Sep 13, 2006 7:31pm
  •  fozzy
  • | Joined Apr 2005 | Status: Member | 62 Posts
Hi Guys,


Thanks all for the comments about my post.

accrete,
Yes it was you who planted the idea and humble apologies for not acknowledging that by name. I had copied your indicators and saved a chart as a template and had not noted who's idea it was originally. When checking back through some of the templates I had and applying more analysis I found that your idea suited my way of trading. I'm grateful for your knowledge and willingness to share.

Foraxtrader81,
You're right with what you see. My explanation was incorrect. You trade long when the RSI crosses above the MA and short when RSI crosses below MA.
Sorry for the confusion.

Sam1,
My BB is set to 20 and is applied to "First Indicators Data". Hope this helps.

Cheers

Fozzy
  • Post #15
  • Quote
  • Sep 13, 2006 7:39pm Sep 13, 2006 7:39pm
  •  summitfx
  • | Additional Username | Joined Jun 2006 | 787 Posts
Thanks Foz- This may be the simplest of all to follow!
Trade what you see - Not what you think :money:
  • Post #16
  • Quote
  • Sep 13, 2006 7:54pm Sep 13, 2006 7:54pm
  •  ziko123
  • | Joined Apr 2006 | Status: Member | 423 Posts
this is the same as "dynamic zone rsi"


http://www.metatradertools.com/_down...ne%20rsi%22%22
  • Post #17
  • Quote
  • Sep 13, 2006 8:25pm Sep 13, 2006 8:25pm
  •  diallist
  • Joined Sep 2004 | Status: Member | 1,464 Posts
Quoting forextrader81
Disliked
Thanks for sharing your method. I think I am seeing this differently. I was looking at the daily charts and when RSI crosses MA which is below the middle band to the upside it is a long entry and vice versa for the short. Is that what you meant or is it MA crossing the RSI to the upside? I see the RSI crossing the MA as a long signal. Let me know what you think.

Thanks
Ignored
I'm seeing it the same way you are. (I think)

LONG: RSI crosses above the MA. Cross must be below middle BB.

SHORT: RSI crosses below the MA. Cross must be above middle BB.
sxaxlxvxaxtxixoxnxbxyxgxrxaxcxexdxoxtxoxrxgx
  • Post #18
  • Quote
  • Sep 13, 2006 8:39pm Sep 13, 2006 8:39pm
  •  fozzy
  • | Joined Apr 2005 | Status: Member | 62 Posts
Quoting diallist
Disliked
I'm seeing it the same way you are. (I think)

LONG: RSI crosses above the MA. Cross must be below middle BB.

SHORT: RSI crosses below the MA. Cross must be above middle BB.
Ignored
Hi diallist,

Yes you are right. My initial description was back to front. Sorry for the confusion.
  • Post #19
  • Quote
  • Sep 13, 2006 8:57pm Sep 13, 2006 8:57pm
  •  diallist
  • Joined Sep 2004 | Status: Member | 1,464 Posts
Quoting fozzy
Disliked
Hi diallist,

Yes you are right. My initial description was back to front. Sorry for the confusion.
Ignored
Hi Fozzy,

No worries mate. Thanks for the clean daily method. I'll be forward testing this one!

Longer time frames rule!

Dial
sxaxlxvxaxtxixoxnxbxyxgxrxaxcxexdxoxtxoxrxgx
  • Post #20
  • Quote
  • Sep 13, 2006 9:20pm Sep 13, 2006 9:20pm
  •  accrete
  • Joined Jan 2006 | Status: Pips Ahoy! | 1,130 Posts
Quoting fozzy
Disliked
Hi Guys,Thanks all for the comments about my post.
accrete...Yes it was you who planted the idea and humble apologies for not acknowledging that by name. ....
Ignored
Fozzy, no apologies needed. This idea was not original on my part, thank Bollinger : ) I just put it together in a pretty package for use in MT4. As i said, i'm blessed that anything i have posted here at the factory has helped bring in even a pip-of-hope for a fellow pipster.

Trade on!
Thom
  • Trading Systems
  • /
  • The Daily Fozzy Method
  • Reply to Thread
    • Page 1 23456 141
    • Page 1 2 141
1 trader viewing now
  • More
Top of Page
  • Facebook
  • Twitter
About FF
  • Mission
  • Products
  • User Guide
  • Media Kit
  • Blog
  • Contact
FF Products
  • Forums
  • Trades
  • Calendar
  • News
  • Market
  • Brokers
  • Trade Explorer
FF Website
  • Homepage
  • Search
  • Members
  • Report a Bug
Follow FF
  • Facebook
  • Twitter

FF Sister Sites:

  • Metals Mine
  • Energy EXCH
  • Crypto Craft

Forex Factory® is a brand of Fair Economy, Inc.

Terms of Service / ©2021