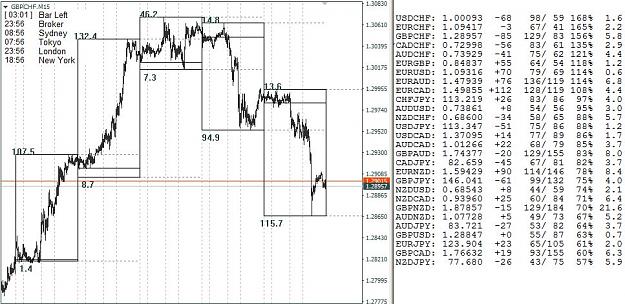
Here is a simple illustration (my chart) of what I wrote above.
Things to consider :
The open-low range in comparison to open-high range in bullish trending days.
The open-high range in comparison to the open-low range in bearish trending days.
Price moving one direction away from the open in trending days.
Activity of the price upon breaking out of the yesterdays high/low
The second dotted vertical line of each day (London open)
Attached Image (click to enlarge)
The truth is hidden from you
1