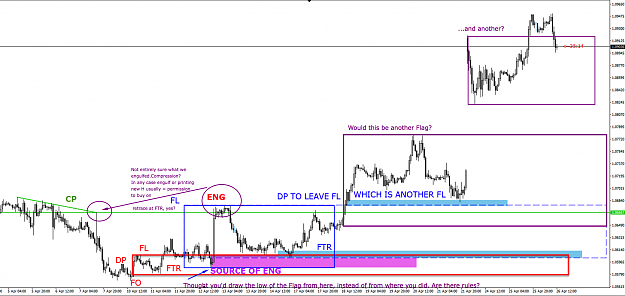
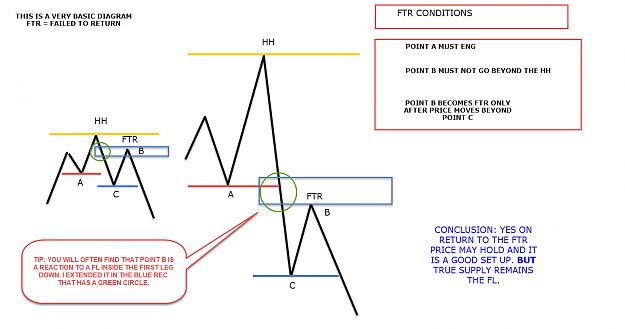
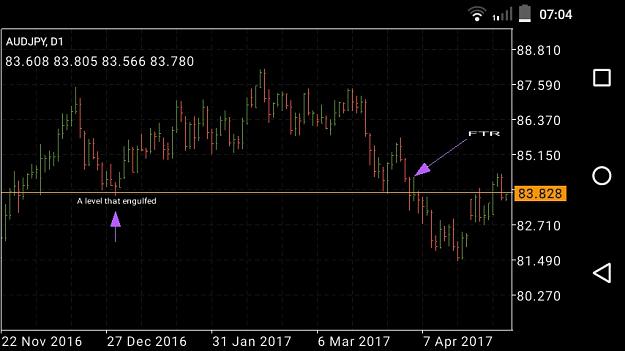
FTR = Failed to return = for example we have an engulf of an FL that is holding price up/down (say up, so the engulf is a bearish sign) then price tries to go back up but fails to make a HH and drops. That failure is the FTR... This is a very general definition.
As mentioned before every FL is also an FTR but not all FTRs are FLs.
FLs come in different forms and sizes, but what is important is what is being engulfed. We draw FLs 1) from the point of engulf (of something important) 2) To the deepest part of the retrace following the engulf 3) before price moves back out beyond the high/low at 1)
FLs wrap themselves around SRs... They are decision points. Some may take longer to unfold and what may look like a huge RBD DBR (Like the FL I drew after it ENG into CP) is in fact a RBR on a higher TF.
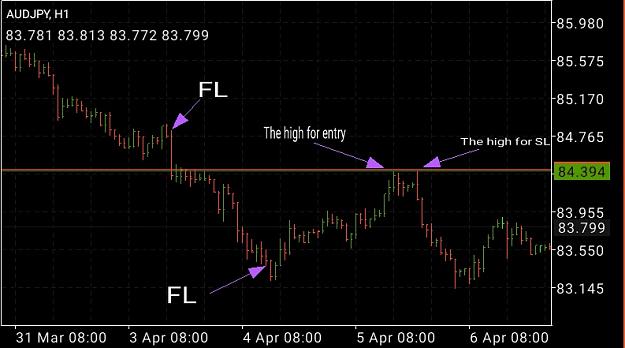
If it from south to north.
The FTR is the first low after bar break north.
And the first high is FL.
Then price move north again leaving the FL.
But price back again to FL.
The highest level from price movement (FL to FL) is Flag.
Sorry about the "ego".
But thanks cause I understand this.
And now everything is rectangle.
|
Joined Feb 2012
|
Status: Trader
|27 Posts|
Online Now
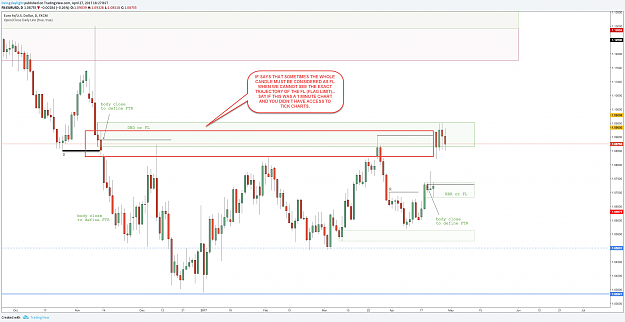
Here is an example
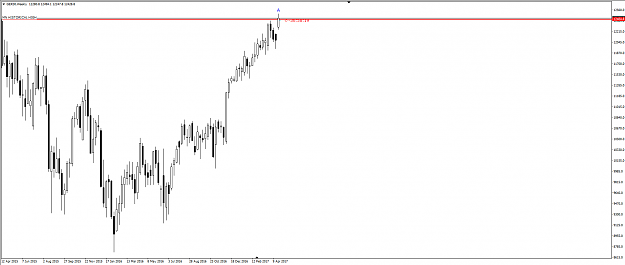
The Dax recently broke the historical high at candle A as seen on W1.
What happened there other than the French elections??… Let’s drop down a TF.
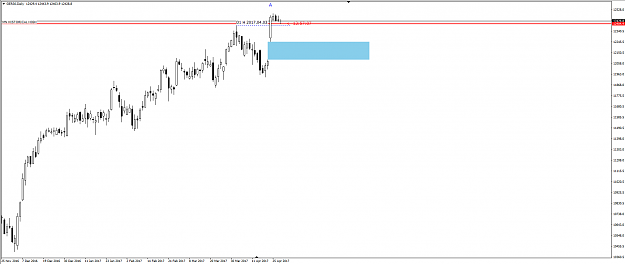
On D1 we see that same move also broke the most recent high of 2017.04.03.
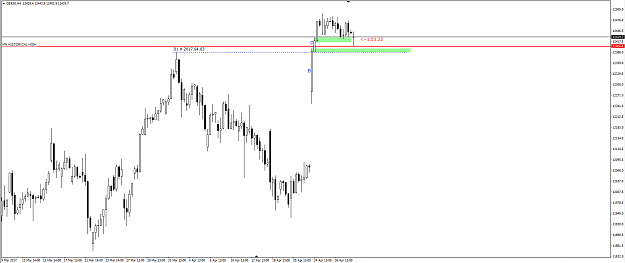
All things being equal and for now let’s ignore that huge gap (Light Blue zone), Let’s see what’s going on in H4.
On this TF I see two important levels highlighted, BUT this is still not the whole story. Because the Decision Point to engulf could be anywhere inside candles B & C…. They each engulfed different levels.
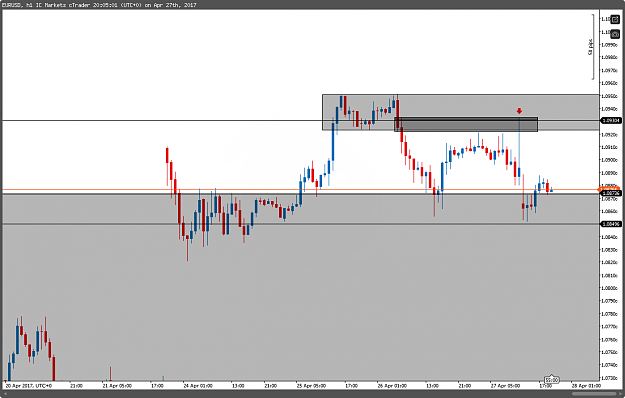
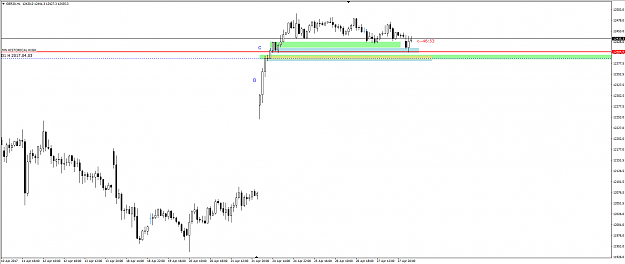
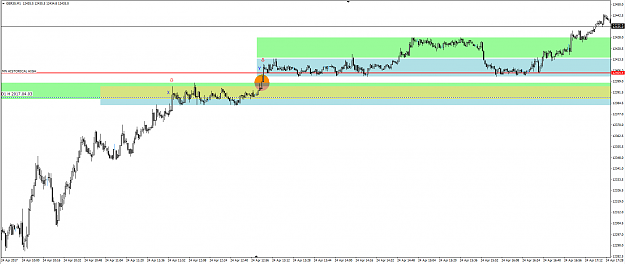
Let’s move on to H1, where we start getting the true picture of how price behaved.
You will see that I’ve added H1 FLs in light blue. Now is that it? No I keep going all the way to M1 and even the tick chart to see where exactly the FLs are and whether or not they held price up (in this example).
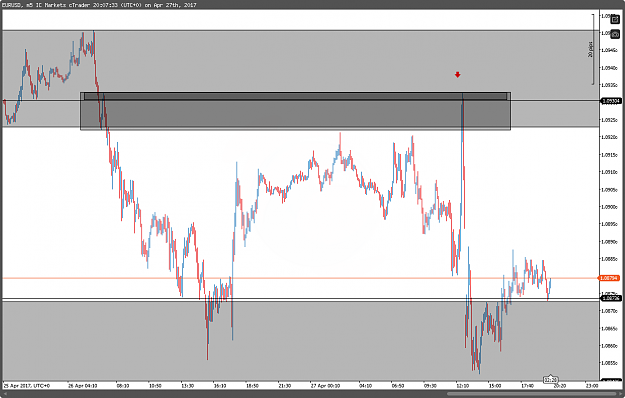
On the M1 chart, candles X & Y are very significant, so is the zone with an ellipse.
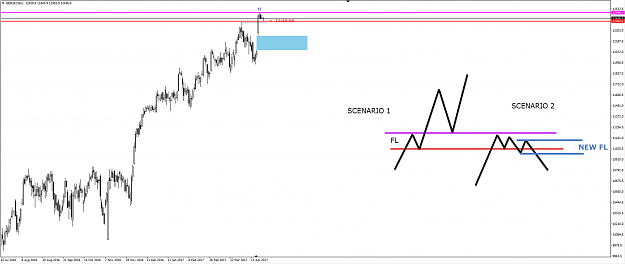
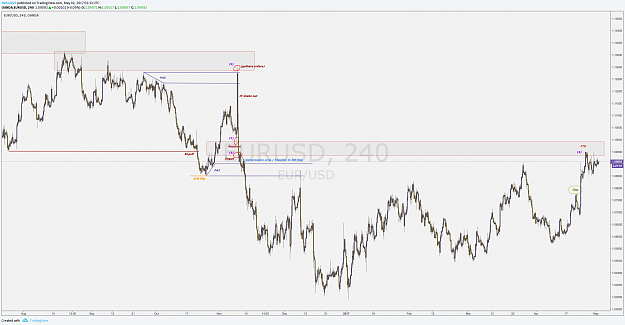
Finally going back to higher TFs and looking at D1, its flag limit is still in the process of being created and will only be valid once price rallies beyond the High in magenta at H. Now this could also be a massive FO especially with this huge CP underneath (clear on D1 & W1).
I sketched two different scenarios on the last chart showing potential moves. Now for the higher TFs, there is nothing that can be traded before one of the two scenarios materializes. However, on lower TFs it’s a whole different ball game and world.
Here is an example The Dax recently broke the historical high at candle A as seen on W1. What happened there other than the French elections?? Lets drop down a TF. On D1 we see that same move also broke the most recent high of 2017.04.03. All things being equal and for now lets ignore that huge gap (Light Blue zone), Lets see whats going on in H4. On this TF I see two important levels highlighted, BUT this is still not the whole story. Because the Decision Point to engulf could be anywhere inside candles B & C. They each engulfed different levels....
{quote} Hi there, FTR = Failed to return = for example we have an engulf of an FL that is holding price up/down (say up, so the engulf is a bearish sign) then price tries to go back up but fails to make a HH and drops. That failure is the FTR... This is a very general definition. As mentioned before every FL is also an FTR but not all FTRs are FLs. FLs come in different forms and sizes, but what is important is what is being engulfed. We draw FLs 1) from the point of engulf (of something important) 2) To the deepest part of the retrace following...
Ignored
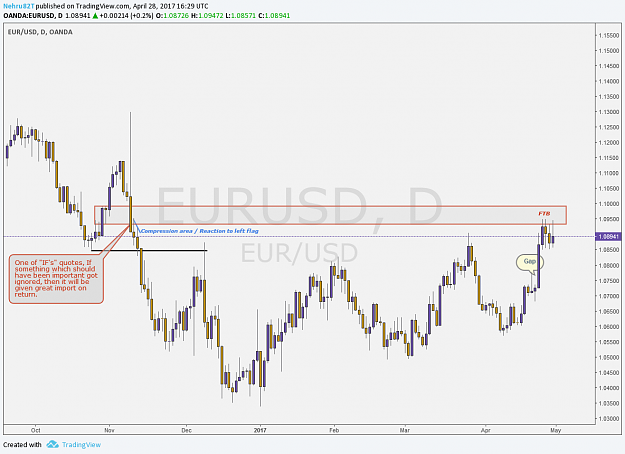
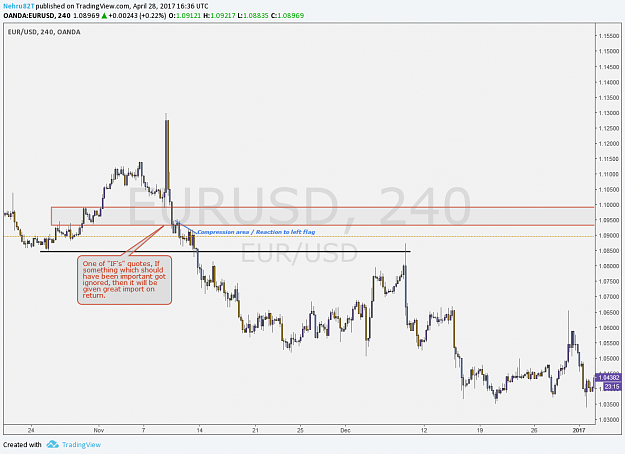
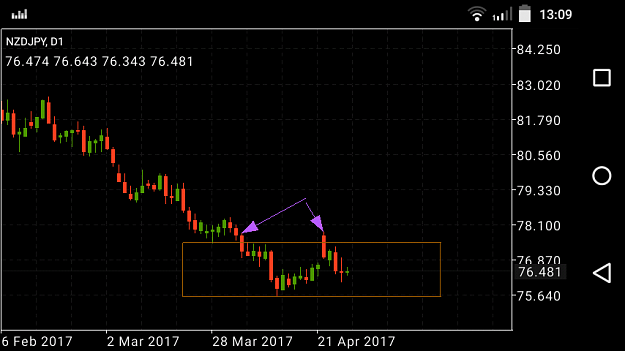
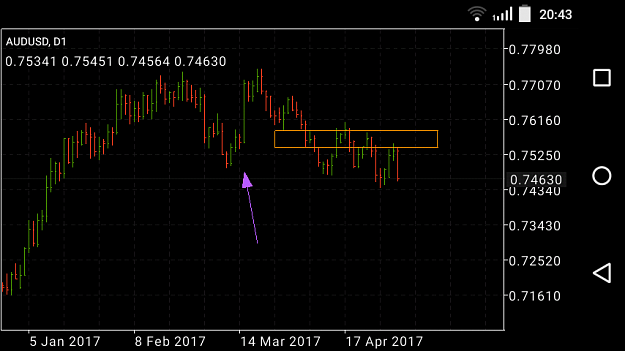
These are FL but the question I always ask myself is how important are they, and are they a reaction to anything? One of "IF's" quotes is If something which should have been important got ignored, Then it will be given great import on return. If you look a little further left you will see a flag limit that was completely ignored, stacked FL right under and a reaction to that area. I'm not saying anyone is wrong, but this is how i see it.
{quote} These are FL but the question I always ask myself is how important are they, and are they a reaction to anything? One of "IF's" quotes is If something which should have been important got ignored, Then it will be given great import on return. If you look a little further left you will see a flag limit that was completely ignored, stacked FL right under and a reaction to that area. I'm not saying anyone is wrong, but this is how i see it. {image} Daily {image} 4hr {image}
Ignored
That flag limit that was ignored as you say holds no significance whatsoever because it did not engulf anything important on the way up to its left. Meaning the bottom of its retrace is not important as well. Charts are full of FLs but our job is to figure out which ones are important.
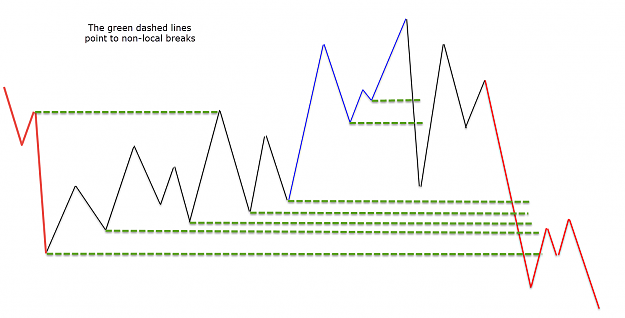
You have several types of FL as well... Local and non-local ones, with the former carrying no weight unless it becomes a DP itself.
Attached is something that might help (all credits go to Pucci - RTM)
{quote} That flag limit that was ignored as you say holds no significance whatsoever because it did not engulf anything important on the way up to its left. Meaning the bottom of its retrace is not important as well. Charts are full of FLs but our job is to figure out which ones are important. You have several types of FL as well... Local and non-local ones, with the former carrying no weight unless it becomes a DP itself. Attached is something that might help (all credits go to Pucci - RTM) {image}
Ignored
Albergo,
Recent times your posts are the best ones that's clearing up lot of doubts for ppl like me( unintelligent slow learners). Hope you continue to post. Good Luck and all the best
Here is an example The Dax recently broke the historical high at candle A as seen on W1. What happened there other than the French elections?? Lets drop down a TF. On D1 we see that same move also broke the most recent high of 2017.04.03. All things being equal and for now lets ignore that huge gap (Light Blue zone), Lets see whats going on in H4. On this TF I see two important levels highlighted, BUT this is still not the whole story. Because the Decision Point to engulf could be anywhere inside candles B & C. They each engulfed different levels....
Ignored
Albergo,
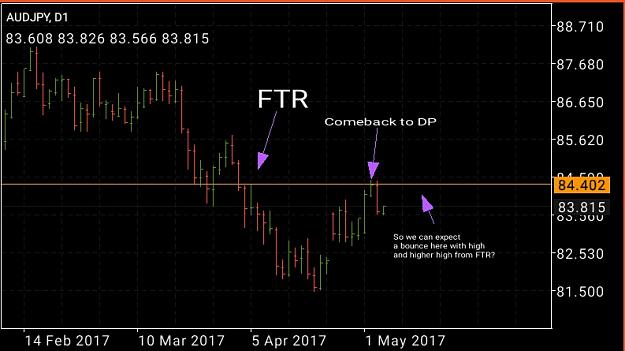
on the 2 scenarios you sketched, the trade opportunity is only when the price returns to the FL right? not when they form the first time and pop or drop?
{quote} That flag limit that was ignored as you say holds no significance whatsoever because it did not engulf anything important on the way up to its left. Meaning the bottom of its retrace is not important as well. Charts are full of FLs but our job is to figure out which ones are important. You have several types of FL as well... Local and non-local ones, with the former carrying no weight unless it becomes a DP itself. Attached is something that might help (all credits go to Pucci - RTM) {image}
Ignored
I appreciate the response and the attachment but can you show me examples on the chart that we're talking about? So i can get a better feel for your explanation.
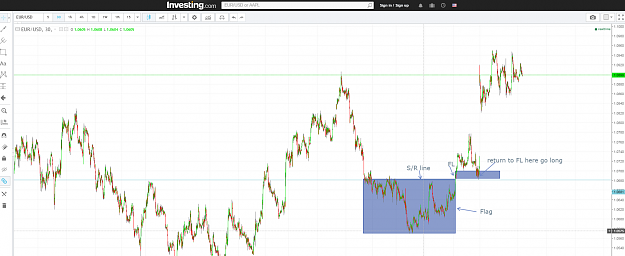
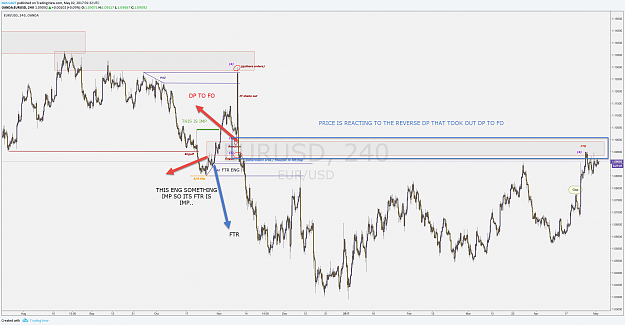
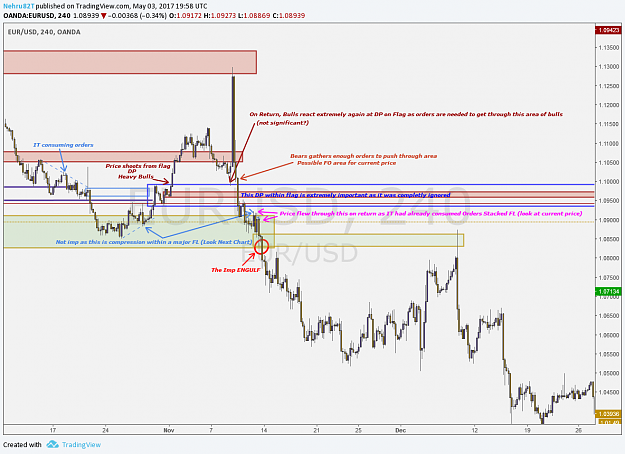
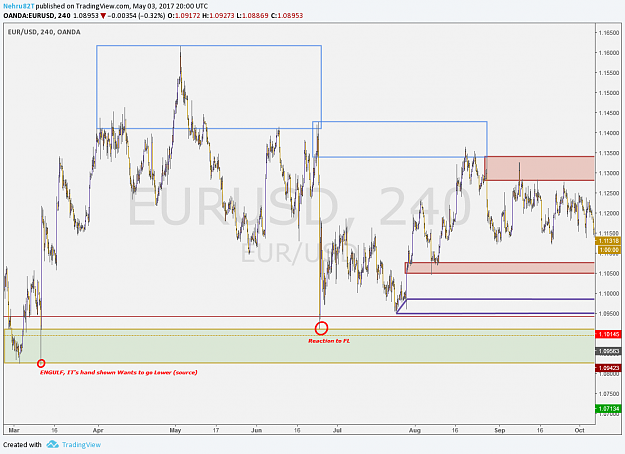
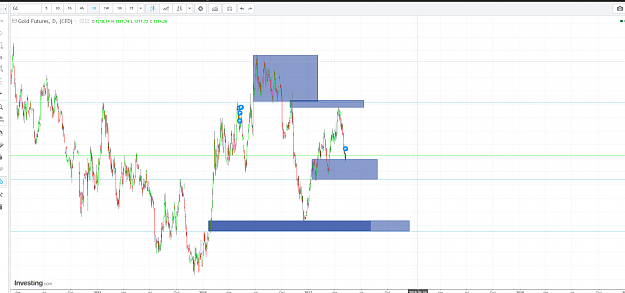
We're looking for how and where price came from and where its going. IT's reached for a better price through compression faking the Breakout traders eventually taking their SL's on return and taking SL's from the sellers to a higher flag.(if you pull out some on the daily it's the big candle with the wick) touched a RBD/supply/Flag, immediately turned and blew through the flag in question on the daily, creating a S/R flip below which we know is an area of interest. Price eventually returned to the FL in question and has since had 2 reactions to it.
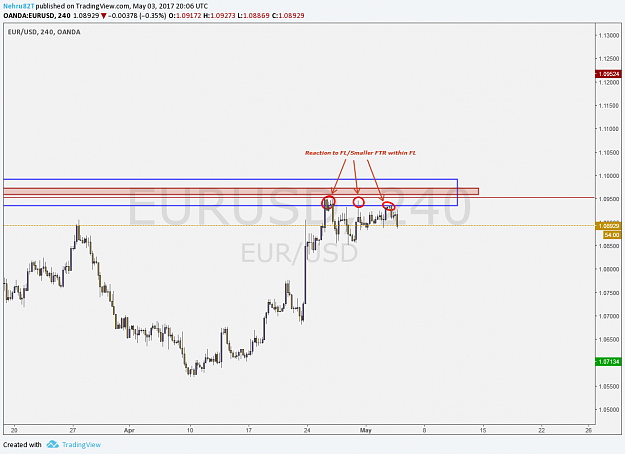
When price shoots away from the flag (see 4hr); gathers orders, turns and completely engulfs said flag, slowly compresses from that area, then on return (2x) has a reaction to that area. Regardless of the boxes we draw, Price itself has proven that this is a significant area.
{quote} I appreciate the response and the attachment but can you show me examples on the chart that we're talking about? So i can get a better feel for your explanation. We're looking for how and where price came from and where its going. IT's reached for a better price through compression faking the Breakout traders eventually taking their SL's on return and taking SL's from the sellers to a higher flag.(if you pull out some on the daily it's the big candle with the wick) touched a RBD/supply/Flag, immediately turned and blew through the flag in...
Ignored
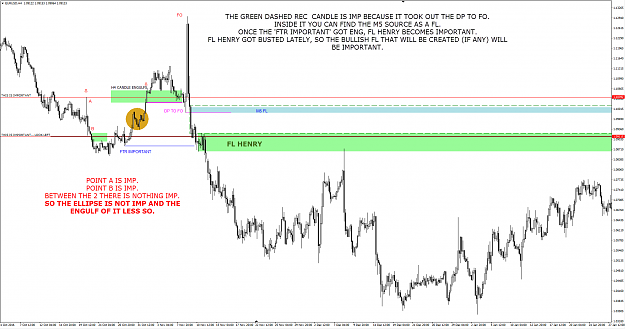
Think in terms of bulls and bears. For the bears to be conquered, a bull move must engulf the source (very tip) of the bear move, retrace back on itself and move out, beyond its initial engulf of the bear tip.
Now the bearish tip can be deep or shallow... but it must also have engulfed something of the bulls that was important i.e. FTR, FL, RBD, DBR etc... the combination has to always be bear-bull or bull-bear.
Yes there are decisions in between that could be bullish-bullish or bearish-bearish, but the war is always between the opposites, and those define our zones.
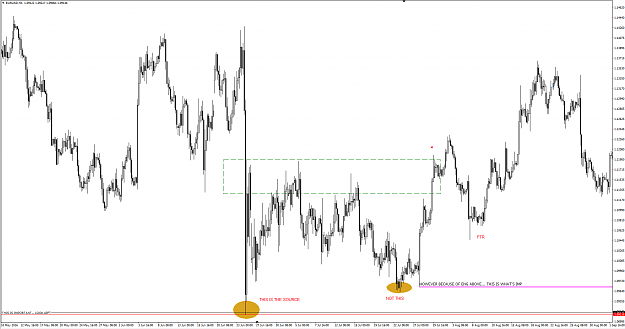
I might add this as well... the market is fractal and what you see on one time frame can be broken down on smaller TFs. I gave an example of that with the blue M5 FL.
{quote} Think in terms of bulls and bears. For the bears to be conquered, a bull move must engulf the source (very tip) of the bear move, retrace back on itself and move out, beyond its initial engulf of the bear tip. Now the bearish tip can be deep or shallow... but it must also have engulfed something of the bulls that was important i.e. FTR, FL, RBD, DBR etc... the combination has to always be bear-bull or bull-bear. Yes there are decisions in between that could be bullish-bullish or bearish-bearish, but the war is always between the opposites,...
Ignored
I agree with your description on price movement, but not that there is no significance attached to the FL marked. I'm definitely not a master RTM'er yet, but we're seeing things differently but in a similar area. If there was no significance, what is Price is currently compressing into? (I only used the 4hr for these charts)
I do want to thank you for the friendly scrutiny of the charts, as this only makes better Traders!!
{quote} Think in terms of bulls and bears. For the bears to be conquered, a bull move must engulf the source (very tip) of the bear move, retrace back on itself and move out, beyond its initial engulf of the bear tip. Now the bearish tip can be deep or shallow... but it must also have engulfed something of the bulls that was important i.e. FTR, FL, RBD, DBR etc... the combination has to always be bear-bull or bull-bear. Yes there are decisions in between that could be bullish-bullish or bearish-bearish, but the war is always between the opposites,...
Ignored
Albegro,
Thanks a lot for your posts!!! Very simple n clear!
Reverse DP is something new for me. Maybe should do a hw on it. Thanks a lot!!!