Master Your Setup, Master Your self. (NQoos)
Similar Threads
FXCM Strategy Trader Delivers the Next Evolution in Automated Trading 12 replies
Yuppie's Evolution... 78 replies
Usd Eur Gold And Silver Evolution... 1 reply
The Evolution of a Trader 13 replies
Trading evolution 0 replies
 ETMA_The Evolution
- #1,741
- Edited 6:44am Apr 15, 2017 2:14am | Edited 6:44am
- Joined Apr 2011 | Status: Cut Your Losses, Ride Your Winners. | 2,914 Posts
- #1,742
- Apr 15, 2017 3:20am Apr 15, 2017 3:20am
- | Commercial User | Joined Apr 2013 | 4,366 Posts
DislikedIs Just wanna wish everybody A Happy Easter . He is Risen . https://www.youtube.com/watch?v=bAuaSpJ7zGsIgnored
- #1,743
- Apr 15, 2017 3:27am Apr 15, 2017 3:27am
- Joined Apr 2011 | Status: Cut Your Losses, Ride Your Winners. | 2,914 Posts
Master Your Setup, Master Your self. (NQoos)
- #1,744
- Apr 17, 2017 6:47am Apr 17, 2017 6:47am
- Joined Apr 2011 | Status: Cut Your Losses, Ride Your Winners. | 2,914 Posts
Ethical Strategy Design
April 17, 2017Jonathan
It isn’t often that you see an equity curve like the one shown below, which was produced by a systematic strategy built on 1-minute bars in the ProShares Ultra VIX Short-Term Futures ETF (UVXY):
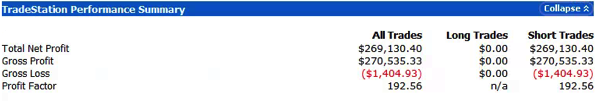
As the chart indicates, the strategy is very profitable, has a very high overall profit factor and a trade win rate in excess of 94%:
Around this point trainees, at least those inexperienced in trading system development, tend to run out of ideas about what else could be done to evaluate the strategy. One or two will mention drawdown risk, but the straight-line equity curve indicates that this has not been a problem for the strategy in the past, while the results of simulation testing suggest that drawdowns are unlikely to be a significant concern, across a broad spectrum of market conditions. Most trainees simply want to start trading the strategy as soon as possible (although the more cautious of them will suggest trading in simulation mode for a while).
As this point I sometimes offer to let trainees see the strategy code, on condition that they agree to trade the strategy with their own capital. Being smart people, they realize something must be wrong, even if they are unable to pinpoint what the problem may be. So the discussion moves on to focus in more detail the question of strategy risk.
A Deeper Dive into Strategy Risk
At this stage I point out to trainees that the equity curve shows the result from realized gains and losses. What it does not show are the fluctuations in equity that occurred before each trade was closed.
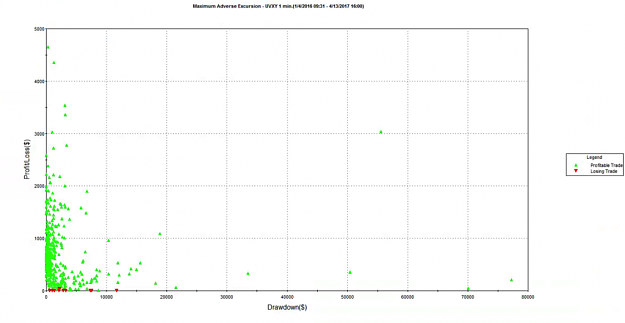
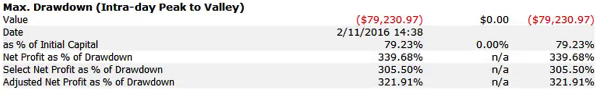
That information is revealed by the following report on the maximum adverse excursion (MAE), which plots the maximum drawdown in each trade vs. the final trade profit or loss. Once trainees understand the report, the lights begin to come on. We can see immediately that there were several trades which were underwater to the tune of $30,000, $50,000, or even $70,000 , or more, before eventually recovering to produce a profit. In the most extreme case the trade was almost $80,000 underwater, before producing a profit of only a few hundred dollars. Furthermore, the drawdown period lasted for several weeks, which represents almost geological time for a strategy operating on 1-minute bars. It’s not hard to grasp the concept that risking $80,000 of your own money in order to make $250 is hardly an efficient use of capital, or an acceptable level of risk-reward.
Next, I ask for suggestions for how to tackle the problem of drawdown risk in the strategy. Most trainees will suggest implementing a stop-loss strategy, similar to those employed by thousands of trading firms. Looking at the MAE chart, it appears that we can avert the worst outcomes with a stop loss limit of, say, $25,000. However, when we implement a stop loss strategy at this level, here’s the outcome it produces:
Now we see the difficulty. Firstly, what a stop-loss strategy does is simply crystallize the previously unrealized drawdown losses. Consequently, the equity curve looks a great deal less attractive than it did before. The second problem is more subtle: the conditions that produced the loss-making trades tend to continue for some time, perhaps as long as several days, or weeks. So, a strategy that has a stop loss risk overlay will tend to exit the existing position, only to reinstate a similar position more or less immediately. In other words, a stop loss achieves very little, other than to force the trader to accept losses that the strategy would have made up if it had been allowed to continue. This outcome is a difficult one to accept, even in the face of the argument that a stop loss serves the purpose of protecting the trader (and his firm) from an even more catastrophic loss. Because if the strategy tends to re-enter exactly the same position shortly after being stopped out, very little has been gained in terms of catastrophic risk management.
Luck and the Ethics of Strategy Design
What are the learning points from this exercise in trading system development? Firstly, one should resist being beguiled by stellar-looking equity curves: they may disguise the true risk characteristics of the strategy, which can only be understood by a close study of strategy drawdowns and trade MAE. Secondly, a lesson that many risk managers could usefully take away is that a stop loss is often counter-productive, serving only to cement losses that the strategy would otherwise have recovered from.
A more subtle point is that a Geometric Brownian Motion process has a long-term probability of reaching any price level with certainty. Accordingly, in theory one has only to wait long enough to recover from any loss, no matter how severe. Of course, in the meantime, the accumulated losses might be enough to decimate the trading account, or even bring down the entire firm (e.g. Barings). The point is, it is not hard to design a system with a very seductive-looking backtest performance record.
If the solution is not a stop loss, how do we avoid scenarios like this one? Firstly, if you are trading someone else’s money, one answer is: be lucky! If you happened to start trading this strategy some time in 2016, you would probably be collecting a large bonus. On the other hand, if you were unlucky enough to start trading in early 2017, you might be collecting a pink slip very soon. Although unethical, when you are gambling with other people’s money, it makes economic sense to take such risks, because the potential upside gain is so much greater than the downside risk (for you). When you are risking with your own capital, however, the calculus is entirely different. That is why we always trade strategies with our own capital before opening them to external investors (and why we insist that our prop traders do the same).
As a strategy designer, you know better, and should act accordingly. Investors, who are relying on your skills and knowledge, can all too easily be seduced by the appearance of a strategy’s outstanding performance, overlooking the latent risks it hides. We see this over and over again in option-selling strategies, which investors continue to pile into despite repeated demonstrations of their capital-destroying potential. Incidentally, this is not a point about backtest vs. live trading performance: the strategy illustrated here, as well as many option-selling strategies, are perfectly capable of producing live track records similar to those seen in backtest. All you need is some luck and an uneventful period in which major drawdowns don’t arise. At Systematic Strategies, our view is that the strategy designer is under an obligation to shield his investors from such latent risks, even if they may be unaware of them. If you know that a strategy has such risk characteristics, you should avoid it, and design a better one. The risk controls, including limitations on unrealized drawdowns (MAE) need to be baked into the strategy design from the outset, not fitted retrospectively (and often counter-productively, as we have seen here).
The acid test is this: if you would not be prepared to risk your own capital in a strategy, don’t ask your investors to take the risk either.
The ethical principle of “do unto others as you would have them do unto you” applies no less in investment finance than it does in life.
Strategy Code
April 17, 2017Jonathan
It isn’t often that you see an equity curve like the one shown below, which was produced by a systematic strategy built on 1-minute bars in the ProShares Ultra VIX Short-Term Futures ETF (UVXY):
As the chart indicates, the strategy is very profitable, has a very high overall profit factor and a trade win rate in excess of 94%:
Around this point trainees, at least those inexperienced in trading system development, tend to run out of ideas about what else could be done to evaluate the strategy. One or two will mention drawdown risk, but the straight-line equity curve indicates that this has not been a problem for the strategy in the past, while the results of simulation testing suggest that drawdowns are unlikely to be a significant concern, across a broad spectrum of market conditions. Most trainees simply want to start trading the strategy as soon as possible (although the more cautious of them will suggest trading in simulation mode for a while).
As this point I sometimes offer to let trainees see the strategy code, on condition that they agree to trade the strategy with their own capital. Being smart people, they realize something must be wrong, even if they are unable to pinpoint what the problem may be. So the discussion moves on to focus in more detail the question of strategy risk.
A Deeper Dive into Strategy Risk
At this stage I point out to trainees that the equity curve shows the result from realized gains and losses. What it does not show are the fluctuations in equity that occurred before each trade was closed.
That information is revealed by the following report on the maximum adverse excursion (MAE), which plots the maximum drawdown in each trade vs. the final trade profit or loss. Once trainees understand the report, the lights begin to come on. We can see immediately that there were several trades which were underwater to the tune of $30,000, $50,000, or even $70,000 , or more, before eventually recovering to produce a profit. In the most extreme case the trade was almost $80,000 underwater, before producing a profit of only a few hundred dollars. Furthermore, the drawdown period lasted for several weeks, which represents almost geological time for a strategy operating on 1-minute bars. It’s not hard to grasp the concept that risking $80,000 of your own money in order to make $250 is hardly an efficient use of capital, or an acceptable level of risk-reward.
Next, I ask for suggestions for how to tackle the problem of drawdown risk in the strategy. Most trainees will suggest implementing a stop-loss strategy, similar to those employed by thousands of trading firms. Looking at the MAE chart, it appears that we can avert the worst outcomes with a stop loss limit of, say, $25,000. However, when we implement a stop loss strategy at this level, here’s the outcome it produces:
Now we see the difficulty. Firstly, what a stop-loss strategy does is simply crystallize the previously unrealized drawdown losses. Consequently, the equity curve looks a great deal less attractive than it did before. The second problem is more subtle: the conditions that produced the loss-making trades tend to continue for some time, perhaps as long as several days, or weeks. So, a strategy that has a stop loss risk overlay will tend to exit the existing position, only to reinstate a similar position more or less immediately. In other words, a stop loss achieves very little, other than to force the trader to accept losses that the strategy would have made up if it had been allowed to continue. This outcome is a difficult one to accept, even in the face of the argument that a stop loss serves the purpose of protecting the trader (and his firm) from an even more catastrophic loss. Because if the strategy tends to re-enter exactly the same position shortly after being stopped out, very little has been gained in terms of catastrophic risk management.
Luck and the Ethics of Strategy Design
What are the learning points from this exercise in trading system development? Firstly, one should resist being beguiled by stellar-looking equity curves: they may disguise the true risk characteristics of the strategy, which can only be understood by a close study of strategy drawdowns and trade MAE. Secondly, a lesson that many risk managers could usefully take away is that a stop loss is often counter-productive, serving only to cement losses that the strategy would otherwise have recovered from.
A more subtle point is that a Geometric Brownian Motion process has a long-term probability of reaching any price level with certainty. Accordingly, in theory one has only to wait long enough to recover from any loss, no matter how severe. Of course, in the meantime, the accumulated losses might be enough to decimate the trading account, or even bring down the entire firm (e.g. Barings). The point is, it is not hard to design a system with a very seductive-looking backtest performance record.
If the solution is not a stop loss, how do we avoid scenarios like this one? Firstly, if you are trading someone else’s money, one answer is: be lucky! If you happened to start trading this strategy some time in 2016, you would probably be collecting a large bonus. On the other hand, if you were unlucky enough to start trading in early 2017, you might be collecting a pink slip very soon. Although unethical, when you are gambling with other people’s money, it makes economic sense to take such risks, because the potential upside gain is so much greater than the downside risk (for you). When you are risking with your own capital, however, the calculus is entirely different. That is why we always trade strategies with our own capital before opening them to external investors (and why we insist that our prop traders do the same).
As a strategy designer, you know better, and should act accordingly. Investors, who are relying on your skills and knowledge, can all too easily be seduced by the appearance of a strategy’s outstanding performance, overlooking the latent risks it hides. We see this over and over again in option-selling strategies, which investors continue to pile into despite repeated demonstrations of their capital-destroying potential. Incidentally, this is not a point about backtest vs. live trading performance: the strategy illustrated here, as well as many option-selling strategies, are perfectly capable of producing live track records similar to those seen in backtest. All you need is some luck and an uneventful period in which major drawdowns don’t arise. At Systematic Strategies, our view is that the strategy designer is under an obligation to shield his investors from such latent risks, even if they may be unaware of them. If you know that a strategy has such risk characteristics, you should avoid it, and design a better one. The risk controls, including limitations on unrealized drawdowns (MAE) need to be baked into the strategy design from the outset, not fitted retrospectively (and often counter-productively, as we have seen here).
The acid test is this: if you would not be prepared to risk your own capital in a strategy, don’t ask your investors to take the risk either.
The ethical principle of “do unto others as you would have them do unto you” applies no less in investment finance than it does in life.
Strategy Code
Attached Image(s) (click to enlarge)


Attached Images

Master Your Setup, Master Your self. (NQoos)
- #1,745
- Apr 19, 2017 8:33am Apr 19, 2017 8:33am
- Joined Apr 2011 | Status: Cut Your Losses, Ride Your Winners. | 2,914 Posts
Quick Take: Percent Exposure Donchian Channel Method
by david varadi
Note: Quick Takes will be short articles introducing new ideas or concepts that haven’t been tested. It is designed to help inspire your own personal systems. If you wish to demonstrate the results of Quick Takes ideas, your results will be published on this site subject to verification.
I have always been fascinated by Donchian Channels as they were the core method used by the legendary turtle traders to achieve their success. Channels are simply bands containing the “n” day high bounded by the “n” day low . They can be seen visually on www.stockcharts.com using their sharp charts by selecting the “price channel.” I noticed that the larger the channel that the stock is currently in, the more likely the trend was to continue. In my own work on ranking stocks, i include a % distance from 52-wk high as part of the momentum factor which does in fact add a fair amount of value to the overall score. Many systems using channels to trade a wide variety of futures and indexes are still robust, even during the new mean reversion era.
What is missing from all of the research that i have ever seen is a percent exposure method to catching trends. Wouldn’t it be smart to increase leverage and exposure as the move becomes confirmed? Most models are either all in or all out, that is why it is difficult to design short-term trend systems. The frequently incorrect signals given by shorter trend signals are too costly using a full bet size. More importantly, signals generated by short-term models that are counter to the longer term trend are more likely to be incorrect or have a poor profit factor.
The question is how do we use this information? First, lets describe how to trade channels: Exits and entries are determined by new channel penetration. That is, a new 50-day high for example would initiate a new long position after a previous 50-day low had been triggered without a 50-day high prior to that. Once a new entry is triggered, you would exit at a channel low that is half of the original channel length. That is, if you entered on a 20-day high, you would exit on a 10-day low, and so-on.
I think there are four concepts that should be stated from my observations regarding channels:
1) the 200 day channel position dictates the main trend: you will have to trace back on the chart to find the first penetration from long to short or vice versa to figure out what the main trend is.
2) smaller channels (a minimum of 20 days-5o days) can be used to trade within the main trend with less risk using a 2 ATR initial stop to minimize potential losses.
3) when trading counter to the prevailing trend, whatever the minimum channel length is in #2 you should use double that length as a trigger— so in this case to enter countertrend in bear markets you would use a 40-day channel, and the same applies to bull markets.
4) when trading counter to the prevailing trend….bet only half as much as when you are with the prevailing trend.
Ok, that is the basic framework. Lets figure out how we can scale in and out of a trend using channels. It makes sense to bet less on small channels, and more on larger channels. Note that when trading countertrend, you would bet half of these amounts:
1) 20% might be bet on a new breakout that is a 20-day high within the prevailing trend
2) 30% more might be bet on a new breakout that is a 50-day high within the prevailing trend
3) 50% more might be bet on a new breakout that is a 100-day high within the prevailing trend
This strategy provides us with a safe mechanism to add and subtract exposure, even when going counter to the main trend. I haven’t tested this out yet, as i have a long and large list. For anyone new to the blog…….this isn’t my core research area (designing stock rankings). But if you do test it out, let me know. I would be pleased to present your results.
Master Your Setup, Master Your self. (NQoos)
1
- #1,746
- Apr 19, 2017 8:36am Apr 19, 2017 8:36am
- Joined Apr 2011 | Status: Cut Your Losses, Ride Your Winners. | 2,914 Posts
Conditional Percentile Channels
FEBRUARY 20, 2015
by david varadi
Ilya Kipnis at Quantstrat recently posted some R code attempting to replicate the ever-popular Percentile Channel Tactical Strategy. The results are similar but not exactly in line- which may have to do with the percentile function as Ilya has pointed out in the comments. In either case, the general spirit remains the same and readers are encouraged to take a look at his analysis of the strategy.
In quantitative finance there is the concept of “Conditional Value at Risk” (CVaR) which is a calculation frequently used in risk management. The general idea is that you are trying to capture the expectation beyond a certain tail of the distribution. The CVaR is preferred to the value at risk because it more comprehensive than looking a just one value. Likewise, Percentile Channels are similar to value at risk in that context as well as traditional Donchian Channels which only look at one reference price. Perhaps a logical improvement would be like CVaR to use the average of the prices above a certain percentile threshold. This is more like calculating the expected upper or lower bound for prices. Furthermore to account for the fact that recent data is progressively more important than older data, we can weight such prices accordingly.In theory, the most important prices are at the extremes and should also be weighted as such. So Conditional Percentile Channels is simply a twist on Percentile Channels incorporating these two ideas. Here is how it would be calculated:
Basically you select a threshold like .75 and .25, and then you weight the prices that are above those thresholds according to both position in time (like a weighted moving average) and distance to max or min. This gives you a more accurate expected upper or lower bound for support and resistance (at least in theory). I know I am going to regret this, but using the same strategy ie- Percentile Channel Tactical Strategy in the last few posts- I substituted in the Conditional Percentile Channels using the same threshold of .75 and .25. All other parameters are identical. Here is how that looks:
Looks like a slight improvement over the original strategy in both returns and risk-adjusted returns. In general, I just like the concept better since it condenses more information about support/resistance than either Donchian Channels or Percentile Channels. It also represents a good complement to moving averages which capture central tendency rather than price movement at the extremes. So there you have it- yet another twist on using channels.
Attached Image(s) (click to enlarge)


Master Your Setup, Master Your self. (NQoos)
1
- #1,747
- Apr 20, 2017 7:09pm Apr 20, 2017 7:09pm
- | Commercial User | Joined Apr 2013 | 4,366 Posts
DislikedQuick Take: Percent Exposure Donchian Channel Method by david varadi Note: Quick Takes will be short articles introducing new ideas or concepts that havent been tested. It is designed to help inspire your own personal systems. If you wish to demonstrate the results of Quick Takes ideas, your results will be published on this site subject to verification. I have always been fascinated by Donchian Channels as they were the core method used by the legendary turtle traders to achieve...Ignored
Great food for thought in that post Bass. Thanks for sharing
PS I like the sound of David Varadi. He oozes common sense.
- #1,748
- Apr 22, 2017 1:58am Apr 22, 2017 1:58am
- Joined Apr 2011 | Status: Cut Your Losses, Ride Your Winners. | 2,914 Posts
Trend Following Wizards – March 2017
April 21st, 2017
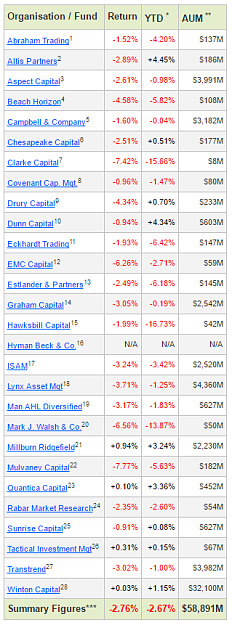
Not many Wizards managed to return positive performance last month as can be seen in the array of red numbers below. The YTD figure is negative and roughly equal to March’s average performance.
Below are the full results as of end March 2017:
April 21st, 2017
Not many Wizards managed to return positive performance last month as can be seen in the array of red numbers below. The YTD figure is negative and roughly equal to March’s average performance.
Below are the full results as of end March 2017:
Attached Image (click to enlarge)
Master Your Setup, Master Your self. (NQoos)
- #1,749
- Edited 1:54am Apr 24, 2017 12:57am | Edited 1:54am
- Joined Apr 2011 | Status: Cut Your Losses, Ride Your Winners. | 2,914 Posts
Beginner's Guide to Quantitative Trading
By Michael Halls-Moore on March 26th, 2013
In this article I'm going to introduce you to some of the basic concepts which accompany an end-to-end quantitative trading system. This post will hopefully serve two audiences. The first will be individuals trying to obtain a job at a fund as a quantitative trader. The second will be individuals who wish to try and set up their own "retail" algorithmic trading business.
Quantitative trading is an extremely sophisticated area of quant finance. It can take a significant amount of time to gain the necessary knowledge to pass an interview or construct your own trading strategies. Not only that but it requires extensive programming expertise, at the very least in a language such as MATLAB, R or Python. However as the trading frequency of the strategy increases, the technological aspects become much more relevant. Thus being familiar with C/C++ will be of paramount importance.
A quantitative trading system consists of four major components:
- Strategy Identification - Finding a strategy, exploiting an edge and deciding on trading frequency
- Strategy Backtesting - Obtaining data, analysing strategy performance and removing biases
- Execution System - Linking to a brokerage, automating the trading and minimising transaction costs
- Risk Management - Optimal capital allocation, "bet size"/Kelly criterion and trading psychology
We'll begin by taking a look at how to identify a trading strategy.
Strategy Identification
All quantitative trading processes begin with an initial period of research. This research process encompasses finding a strategy, seeing whether the strategy fits into a portfolio of other strategies you may be running, obtaining any data necessary to test the strategy and trying to optimise the strategy for higher returns and/or lower risk. You will need to factor in your own capital requirements if running the strategy as a "retail" trader and how any transaction costs will affect the strategy.
Contrary to popular belief it is actually quite straightforward to find profitable strategies through various public sources. Academics regularly publish theoretical trading results (albeit mostly gross of transaction costs). Quantitative finance blogs will discuss strategies in detail. Trade journals will outline some of the strategies employed by funds.
You might question why individuals and firms are keen to discuss their profitable strategies, especially when they know that others "crowding the trade" may stop the strategy from working in the long term. The reason lies in the fact that they will not often discuss the exact parameters and tuning methods that they have carried out. These optimisations are the key to turning a relatively mediocre strategy into a highly profitable one. In fact, one of the best ways to create your own unique strategies is to find similar methods and then carry out your own optimisation procedure.
Here is a small list of places to begin looking for strategy ideas:
- Social Science Research Network - www.ssrn.com
- arXiv Quantitative Finance - arxiv.org/archive/q-fin
- Seeking Alpha - www.seekingalpha.com
- Elite Trader - www.elitetrader.com
- Nuclear Phynance - www.nuclearphynance.com
- Quantivity - quantivity.wordpress.com
Many of the strategies you will look at will fall into the categories of mean-reversion and trend-following/momentum. A mean-reverting strategy is one that attempts to exploit the fact that a long-term mean on a "price series" (such as the spread between two correlated assets) exists and that short term deviations from this mean will eventually revert. A momentum strategy attempts to exploit both investor psychology and big fund structure by "hitching a ride" on a market trend, which can gather momentum in one direction, and follow the trend until it reverses.
Another hugely important aspect of quantitative trading is the frequency of the trading strategy. Low frequency trading (LFT) generally refers to any strategy which holds assets longer than a trading day. Correspondingly, high frequency trading (HFT) generally refers to a strategy which holds assets intraday. Ultra-high frequency trading (UHFT) refers to strategies that hold assets on the order of seconds and milliseconds. As a retail practitioner HFT and UHFT are certainly possible, but only with detailed knowledge of the trading "technology stack" and order book dynamics. We won't discuss these aspects to any great extent in this introductory article.
Once a strategy, or set of strategies, has been identified it now needs to be tested for profitability on historical data. That is the domain of backtesting.
Strategy Backtesting
The goal of backtesting is to provide evidence that the strategy identified via the above process is profitable when applied to both historical and out-of-sample data. This sets the expectation of how the strategy will perform in the "real world". However, backtesting is NOT a guarantee of success, for various reasons. It is perhaps the most subtle area of quantitative trading since it entails numerous biases, which must be carefully considered and eliminated as much as possible. We will discuss the common types of bias including look-ahead bias, survivorship bias and optimisation bias (also known as "data-snooping" bias). Other areas of importance within backtesting include availability and cleanliness of historical data, factoring in realistic transaction costs and deciding upon a robust backtesting platform. We'll discuss transaction costs further in the Execution Systems section below.
Once a strategy has been identified, it is necessary to obtain the historical data through which to carry out testing and, perhaps, refinement. There are a significant number of data vendors across all asset classes. Their costs generally scale with the quality, depth and timeliness of the data. The traditional starting point for beginning quant traders (at least at the retail level) is to use the free data set from Yahoo Finance. I won't dwell on providers too much here, rather I would like to concentrate on the general issues when dealing with historical data sets.
The main concerns with historical data include accuracy/cleanliness, survivorship bias and adjustment for corporate actions such as dividends and stock splits:
- Accuracy pertains to the overall quality of the data - whether it contains any errors. Errors can sometimes be easy to identify, such as with a spike filter, which will pick out incorrect "spikes" in time series data and correct for them. At other times they can be very difficult to spot. It is often necessary to have two or more providers and then check all of their data against each other.
- Survivorship bias is often a "feature" of free or cheap datasets. A dataset with survivorship bias means that it does not contain assets which are no longer trading. In the case of equities this means delisted/bankrupt stocks. This bias means that any stock trading strategy tested on such a dataset will likely perform better than in the "real world" as the historical "winners" have already been preselected.
- Corporate actions include "logistical" activities carried out by the company that usually cause a step-function change in the raw price, that should not be included in the calculation of returns of the price. Adjustments for dividends and stock splits are the common culprits. A process known as back adjustment is necessary to be carried out at each one of these actions. One must be very careful not to confuse a stock split with a true returns adjustment. Many a trader has been caught out by a corporate action!
In order to carry out a backtest procedure it is necessary to use a software platform. You have the choice between dedicated backtest software, such as Tradestation, a numerical platform such as Excel or MATLAB or a full custom implementation in a programming language such as Python or C++. I won't dwell too much on Tradestation (or similar), Excel or MATLAB, as I believe in creating a full in-house technology stack (for reasons outlined below). One of the benefits of doing so is that the backtest software and execution system can be tightly integrated, even with extremely advanced statistical strategies. For HFT strategies in particular it is essential to use a custom implementation.
When backtesting a system one must be able to quantify how well it is performing. The "industry standard" metrics for quantitative strategies are the maximum drawdown and the Sharpe Ratio. The maximum drawdown characterises the largest peak-to-trough drop in the account equity curve over a particular time period (usually annual). This is most often quoted as a percentage. LFT strategies will tend to have larger drawdowns than HFT strategies, due to a number of statistical factors. A historical backtest will show the past maximum drawdown, which is a good guide for the future drawdown performance of the strategy. The second measurement is the Sharpe Ratio, which is heuristically defined as the average of the excess returns divided by the standard deviation of those excess returns. Here, excess returns refers to the return of the strategy above a pre-determined benchmark, such as the S&P500 or a 3-month Treasury Bill. Note that annualised return is not a measure usually utilised, as it does not take into account the volatility of the strategy (unlike the Sharpe Ratio).
Once a strategy has been backtested and is deemed to be free of biases (in as much as that is possible!), with a good Sharpe and minimised drawdowns, it is time to build an execution system.
Execution Systems
An execution system is the means by which the list of trades generated by the strategy are sent and executed by the broker. Despite the fact that the trade generation can be semi- or even fully-automated, the execution mechanism can be manual, semi-manual (i.e. "one click") or fully automated. For LFT strategies, manual and semi-manual techniques are common. For HFT strategies it is necessary to create a fully automated execution mechanism, which will often be tightly coupled with the trade generator (due to the interdependence of strategy and technology).
The key considerations when creating an execution system are the interface to the brokerage, minimisation of transaction costs (including commission, slippage and the spread) and divergence of performance of the live system from backtested performance.
There are many ways to interface to a brokerage. They range from calling up your broker on the telephone right through to a fully-automated high-performance Application Programming Interface (API). Ideally you want to automate the execution of your trades as much as possible. This frees you up to concentrate on further research, as well as allow you to run multiple strategies or even strategies of higher frequency (in fact, HFT is essentially impossible without automated execution). The common backtesting software outlined above, such as MATLAB, Excel and Tradestation are good for lower frequency, simpler strategies. However it will be necessary to construct an in-house execution system written in a high performance language such as C++ in order to do any real HFT. As an anecdote, in the fund I used to be employed at, we had a 10 minute "trading loop" where we would download new market data every 10 minutes and then execute trades based on that information in the same time frame. This was using an optimised Python script. For anything approaching minute- or second-frequency data, I believe C/C++ would be more ideal.
In a larger fund it is often not the domain of the quant trader to optimise execution. However in smaller shops or HFT firms, the traders ARE the executors and so a much wider skillset is often desirable. Bear that in mind if you wish to be employed by a fund. Your programming skills will be as important, if not more so, than your statistics and econometrics talents!
Another major issue which falls under the banner of execution is that of transaction cost minimisation. There are generally three components to transaction costs: Commissions (or tax), which are the fees charged by the brokerage, the exchange and the SEC (or similar governmental regulatory body); slippage, which is the difference between what you intended your order to be filled at versus what it was actually filled at; spread, which is the difference between the bid/ask price of the security being traded. Note that the spread is NOT constant and is dependent upon the current liquidity (i.e. availability of buy/sell orders) in the market.
Transaction costs can make the difference between an extremely profitable strategy with a good Sharpe ratio and an extremely unprofitable strategy with a terrible Sharpe ratio. It can be a challenge to correctly predict transaction costs from a backtest. Depending upon the frequency of the strategy, you will need access to historical exchange data, which will include tick data for bid/ask prices. Entire teams of quants are dedicated to optimisation of execution in the larger funds, for these reasons. Consider the scenario where a fund needs to offload a substantial quantity of trades (of which the reasons to do so are many and varied!). By "dumping" so many shares onto the market, they will rapidly depress the price and may not obtain optimal execution. Hence algorithms which "drip feed" orders onto the market exist, although then the fund runs the risk of slippage. Further to that, other strategies "prey" on these necessities and can exploit the inefficiencies. This is the domain of fund structure arbitrage.
The final major issue for execution systems concerns divergence of strategy performance from backtested performance. This can happen for a number of reasons. We've already discussed look-ahead bias and optimisation bias in depth, when considering backtests. However, some strategies do not make it easy to test for these biases prior to deployment. This occurs in HFT most predominantly. There may be bugs in the execution system as well as the trading strategy itself that do not show up on a backtest but DO show up in live trading. The market may have been subject to a regime change subsequent to the deployment of your strategy. New regulatory environments, changing investor sentiment and macroeconomic phenomena can all lead to divergences in how the market behaves and thus the profitability of your strategy.
Risk Management
The final piece to the quantitative trading puzzle is the process of risk management. "Risk" includes all of the previous biases we have discussed. It includes technology risk, such as servers co-located at the exchange suddenly developing a hard disk malfunction. It includes brokerage risk, such as the broker becoming bankrupt (not as crazy as it sounds, given the recent scare with MF Global!). In short it covers nearly everything that could possibly interfere with the trading implementation, of which there are many sources. Whole books are devoted to risk management for quantitative strategies so I wont't attempt to elucidate on all possible sources of risk here.
Risk management also encompasses what is known as optimal capital allocation, which is a branch of portfolio theory. This is the means by which capital is allocated to a set of different strategies and to the trades within those strategies. It is a complex area and relies on some non-trivial mathematics. The industry standard by which optimal capital allocation and leverage of the strategies are related is called the Kelly criterion. Since this is an introductory article, I won't dwell on its calculation. The Kelly criterion makes some assumptions about the statistical nature of returns, which do not often hold true in financial markets, so traders are often conservative when it comes to the implementation.
Another key component of risk management is in dealing with one's own psychological profile. There are many cognitive biases that can creep in to trading. Although this is admittedly less problematic with algorithmic trading if the strategy is left alone! A common bias is that of loss aversion where a losing position will not be closed out due to the pain of having to realise a loss. Similarly, profits can be taken too early because the fear of losing an already gained profit can be too great. Another common bias is known as recency bias. This manifests itself when traders put too much emphasis on recent events and not on the longer term. Then of course there are the classic pair of emotional biases - fear and greed. These can often lead to under- or over-leveraging, which can cause blow-up (i.e. the account equity heading to zero or worse!) or reduced profits.
Summary
As can be seen, quantitative trading is an extremely complex, albeit very interesting, area of quantitative finance. I have literally scratched the surface of the topic in this article and it is already getting rather long! Whole books and papers have been written about issues which I have only given a sentence or two towards. For that reason, before applying for quantitative fund trading jobs, it is necessary to carry out a significant amount of groundwork study. At the very least you will need an extensive background in statistics and econometrics, with a lot of experience in implementation, via a programming language such as MATLAB, Python or R. For more sophisticated strategies at the higher frequency end, your skill set is likely to include Linux kernel modification, C/C++, assembly programming and network latency optimisation.
If you are interested in trying to create your own algorithmic trading strategies, my first suggestion would be to get good at programming. My preference is to build as much of the data grabber, strategy backtester and execution system by yourself as possible. If your own capital is on the line, wouldn't you sleep better at night knowing that you have fully tested your system and are aware of its pitfalls and particular issues? Outsourcing this to a vendor, while potentially saving time in the short term, could be extremely expensive in the long-term.
Master Your Setup, Master Your self. (NQoos)
- #1,750
- Apr 24, 2017 2:19am Apr 24, 2017 2:19am
- Joined Apr 2011 | Status: Cut Your Losses, Ride Your Winners. | 2,914 Posts
Can Algorithmic Traders Still Succeed at the Retail Level?
By Michael Halls-Moore on May 2nd, 2013
It is common, as a beginning algorithmic trader practising at retail level, to question whether it is still possible to compete with the large institutional quant funds. In this article I would like to argue that due to the nature of the institutional regulatory environment, the organisational structure and a need to maintain investor relations, that funds suffer from certain disadvantages that do not concern retail algorithmic traders.
The capital and regulatory constraints imposed on funds lead to certain predictable behaviours, which are able to be exploited by a retail trader. "Big money" moves the markets, and as such one can dream up many strategies to take advantage of such movements. We will discuss some of these strategies in future articles. At this stage I would like to highlight the comparative advantages enjoyed by the algorithmic trader over many larger funds.
Trading Advantages
There are many ways in which a retail algo trader can compete with a fund on their trading process alone, but there are also some disadvantages:
- Capacity - A retail trader has greater freedom to play in smaller markets. They can generate significant returns in these spaces, even while institutional funds can't.
- Crowding the trade - Funds suffer from "technology transfer", as staff turnover can be high. Non-Disclosure Agreements and Non-Compete Agreements mitigate the issue, but it still leads to many quant funds "chasing the same trade". Whimsical investor sentiment and the "next hot thing" exacerbate the issue. Retail traders are not constrained to follow the same strategies and so can remain uncorrelated to the larger funds.
- Market impact - When playing in highly liquid, non-OTC markets, the low capital base of retail accounts reduces market impact substantially.
- Leverage - A retail trader, depending upon their legal setup, is constrained by margin/leverage regulations. Private investment funds do not suffer from the same disadvantage, although they are equally constrained from a risk management perspective.
- Liquidity - Having access to a prime brokerage is out of reach of the average retail algo trader. They have to "make do" with a retail brokerage such as Interactive Brokers. Hence there is reduced access to liquidity in certain instruments. Trade order-routing is also less clear and is one way in which strategy performance can diverge from backtests.
- Client news flow - Potentially the most important disadvantage for the retail trader is lack of access to client news flow from their prime brokerage or credit-providing institution. Retail traders have to make use of non-traditional sources such as meet-up groups, blogs, forums and open-access financial journals.
Risk Management
Retail algo traders often take a different approach to risk management than the larger quant funds. It is often advantageous to be "small and nimble" in the context of risk.
Crucially, there is no risk management budget imposed on the trader beyond that which they impose themselves, nor is there a compliance or risk management department enforcing oversight. This allows the retail trader to deploy custom or preferred risk modelling methodologies, without the need to follow "industry standards" (an implicit investor requirement).
However, the alternative argument is that this flexibility can lead to retail traders to becoming "sloppy" with risk management. Risk concerns may be built-in to the backtest and execution process, without external consideration given to portfolio risk as a whole. Although "deep thought" might be applied to the alpha model (strategy), risk management might not achieve a similar level of consideration.
Investor Relations
Outside investors are the key difference between retail shops and large funds. This drives all manner of incentives for the larger fund - issues which the retail trader need not concern themselves with:
- Compensation structure - In the retail environment the trader is concerned only with absolute return. There are no high-water marks to be met and no capital deployment rules to follow. Retail traders are also able to suffer more volatile equity curves since nobody is watching their performance who might be capable of redeeming capital from their fund.
- Regulations and reporting - Beyond taxation there is little in the way of regulatory reporting constraints for the retail trader. Further, there is no need to provide monthly performance reports or "dress up" a portfolio prior to a client newsletter being sent. This is a big time-saver.
- Benchmark comparison - Funds are not only compared with their peers, but also "industry benchmarks". For a long-only US equities fund, investors will want to see returns in excess of the S&P500, for example. Retail traders are not enforced in the same way to compare their strategies to a benchmark.
- Performance fees - The downside to running your own portfolio as a retail trader are the lack of management and performance fees enjoyed by the successful quant funds. There is no "2 and 20" to be had at the retail level!
Technology
One area where the retail trader is at a significant advantage is in the choice of technology stack for the trading system. Not only can the trader pick the "best tools for the job" as they see fit, but there are no concerns about legacy systems integration or firm-wide IT policies. Newer languages such as Python or R now possess packages to construct an end-to-end backtesting, execution, risk and portfolio management system with far fewer lines-of-code (LOC) than may be needed in a more verbose language such as C++.
However, this flexibility comes at a price. One either has to build the stack themselves or outsource all or part of it to vendors. This is expensive in terms of time, capital or both. Further, a trader must debug all aspects of the trading system - a long and potentially painstaking process. All desktop research machines and any co-located servers must be paid for directly out of trading profits as there are no management fees to cover expenses.
In conclusion, it can be seen that retail traders possess significant comparative advantages over the larger quant funds. Potentially, there are many ways in which these advantages can be exploited. Later articles will discuss some strategies that make use of these differences.
Master Your Setup, Master Your self. (NQoos)
- #1,751
- Apr 24, 2017 2:52am Apr 24, 2017 2:52am
- Joined Apr 2011 | Status: Cut Your Losses, Ride Your Winners. | 2,914 Posts
How to Identify Algorithmic Trading Strategies
By Michael Halls-Moore on April 19th, 2013
In this article I want to introduce you to the methods by which I myself identify profitable algorithmic trading strategies. Our goal today is to understand in detail how to find, evaluate and select such systems. I'll explain how identifying strategies is as much about personal preference as it is about strategy performance, how to determine the type and quantity of historical data for testing, how to dispassionately evaluate a trading strategy and finally how to proceed towards the backtesting phase and strategy implementation.
Identifying Your Own Personal Preferences for Trading
In order to be a successful trader - either discretionally or algorithmically - it is necessary to ask yourself some honest questions. Trading provides you with the ability to lose money at an alarming rate, so it is necessary to "know thyself" as much as it is necessary to understand your chosen strategy.
I would say the most important consideration in trading is being aware of your own personality. Trading, and algorithmic trading in particular, requires a significant degree of discipline, patience and emotional detachment. Since you are letting an algorithm perform your trading for you, it is necessary to be resolved not to interfere with the strategy when it is being executed. This can be extremely difficult, especially in periods of extended drawdown. However, many strategies that have been shown to be highly profitable in a backtest can be ruined by simple interference. Understand that if you wish to enter the world of algorithmic trading you will be emotionally tested and that in order to be successful, it is necessary to work through these difficulties!
The next consideration is one of time. Do you have a full time job? Do you work part time? Do you work from home or have a long commute each day? These questions will help determine the frequency of the strategy that you should seek. For those of you in full time employment, an intraday futures strategy may not be appropriate (at least until it is fully automated!). Your time constraints will also dictate the methodology of the strategy. If your strategy is frequently traded and reliant on expensive news feeds (such as a Bloomberg terminal) you will clearly have to be realistic about your ability to successfully run this while at the office! For those of you with a lot of time, or the skills to automate your strategy, you may wish to look into a more technical high-frequency trading (HFT) strategy.
My belief is that it is necessary to carry out continual research into your trading strategies to maintain a consistently profitable portfolio. Few strategies stay "under the radar" forever. Hence a significant portion of the time allocated to trading will be in carrying out ongoing research. Ask yourself whether you are prepared to do this, as it can be the difference between strong profitability or a slow decline towards losses.
You also need to consider your trading capital. The generally accepted ideal minimum amount for a quantitative strategy is 50,000 USD (approximately £35,000 for us in the UK). If I was starting again, I would begin with a larger amount, probably nearer 100,000 USD (approximately £70,000). This is because transaction costs can be extremely expensive for mid- to high-frequency strategies and it is necessary to have sufficient capital to absorb them in times of drawdown. If you are considering beginning with less than 10,000 USD then you will need to restrict yourself to low-frequency strategies, trading in one or two assets, as transaction costs will rapidly eat into your returns. Interactive Brokers, which is one of the friendliest brokers to those with programming skills, due to its API, has a retail account minimum of 10,000 USD.
Programming skill is an important factor in creating an automated algorithmic trading strategy. Being knowledgeable in a programming language such as C++, Java, C#, Python or R will enable you to create the end-to-end data storage, backtest engine and execution system yourself. This has a number of advantages, chief of which is the ability to be completely aware of all aspects of the trading infrastructure. It also allows you to explore the higher frequency strategies as you will be in full control of your "technology stack". While this means that you can test your own software and eliminate bugs, it also means more time spent coding up infrastructure and less on implementing strategies, at least in the earlier part of your algo trading career. You may find that you are comfortable trading in Excel or MATLAB and can outsource the development of other components. I would not recommend this however, particularly for those trading at high frequency.
You need to ask yourself what you hope to achieve by algorithmic trading. Are you interested in a regular income, whereby you hope to draw earnings from your trading account? Or, are you interested in a long-term capital gain and can afford to trade without the need to drawdown funds? Income dependence will dictate the frequency of your strategy. More regular income withdrawals will require a higher frequency trading strategy with less volatility (i.e. a higher Sharpe ratio). Long-term traders can afford a more sedate trading frequency.
Finally, do not be deluded by the notion of becoming extremely wealthy in a short space of time! Algo trading is NOT a get-rich-quick scheme - if anything it can be a become-poor-quick scheme. It takes significant discipline, research, diligence and patience to be successful at algorithmic trading. It can take months, if not years, to generate consistent profitability.
Sourcing Algorithmic Trading Ideas
Despite common perceptions to the contrary, it is actually quite straightforward to locate profitable trading strategies in the public domain. Never have trading ideas been more readily available than they are today. Academic finance journals, pre-print servers, trading blogs, trading forums, weekly trading magazines and specialist texts provide thousands of trading strategies with which to base your ideas upon.
Our goal as quantitative trading researchers is to establish a strategy pipeline that will provide us with a stream of ongoing trading ideas. Ideally we want to create a methodical approach to sourcing, evaluating and implementing strategies that we come across. The aims of the pipeline are to generate a consistent quantity of new ideas and to provide us with a framework for rejecting the majority of these ideas with the minimum of emotional consideration.
We must be extremely careful not to let cognitive biases influence our decision making methodology. This could be as simple as having a preference for one asset class over another (gold and other precious metals come to mind) because they are perceived as more exotic. Our goal should always be to find consistently profitable strategies, with positive expectation. The choice of asset class should be based on other considerations, such as trading capital constraints, brokerage fees and leverage capabilities.
If you are completely unfamiliar with the concept of a trading strategy then the first place to look is with established textbooks. Classic texts provide a wide range of simpler, more straightforward ideas, with which to familiarise yourself with quantitative trading. Here is a selection that I recommend for those who are new to quantitative trading, which gradually become more sophisticated as you work through the list:
- Quantitative Trading: How to Build Your Own Algorithmic Trading Business (Wiley Trading)http://www.assoc-amazon.com/e/ir?t=q...1&a=0470284889 - Ernest Chan
- Algorithmic Trading and DMA: An introduction to direct access trading strategieshttp://www.assoc-amazon.com/e/ir?t=q...1&a=0956399207 - Barry Johnson
- Option Volatility & Pricing: Advanced Trading Strategies and Techniqueshttp://www.assoc-amazon.com/e/ir?t=q...1&a=155738486X - Sheldon Natenberg
- Volatility Tradinghttp://www.assoc-amazon.com/e/ir?t=q...1&a=0470181990 - Euan Sinclair
- Trading and Exchanges: Market Microstructure for Practitionershttp://www.assoc-amazon.com/e/ir?t=q...1&a=0195144708 - Larry Harris
For a longer list of quantitative trading books, please visit the QuantStart reading list.
The next place to find more sophisticated strategies is with trading forums and trading blogs. However, a note of caution: Many trading blogs rely on the concept of technical analysis. Technical analysis involves utilising basic indicators and behavioural psychology to determine trends or reversal patterns in asset prices.
Despite being extremely popular in the overall trading space, technical analysis is considered somewhat ineffective in the quantitative finance community. Some have suggested that it is no better than reading a horoscope or studying tea leaves in terms of its predictive power! In reality there are successful individuals making use of technical analysis. However, as quants with a more sophisticated mathematical and statistical toolbox at our disposal, we can easily evaluate the effectiveness of such "TA-based" strategies and make data-based decisions rather than base ours on emotional considerations or preconceptions.
Here is a list of well-respected algorithmic trading blogs and forums:
- The Whole Street
- Quantivity
- Quantitative Trading (Ernest Chan)
- Quantopian
- Quantpedia
- ETF HQ
- Quant.ly
- Elite Trader Forums
- Wealth Lab
- Nuclear Phynance
- Wilmott Forums
Once you have had some experience at evaluating simpler strategies, it is time to look at the more sophisticated academic offerings. Some academic journals will be difficult to access, without high subscriptions or one-off costs. If you are a member or alumnus of a university, you should be able to obtain access to some of these financial journals. Otherwise, you can look at pre-print servers, which are internet repositories of late drafts of academic papers that are undergoing peer review. Since we are only interested in strategies that we can successfully replicate, backtest and obtain profitability for, a peer review is of less importance to us.
The major downside of academic strategies is that they can often either be out of date, require obscure and expensive historical data, trade in illiquid asset classes or do not factor in fees, slippage or spread. It can also be unclear whether the trading strategy is to be carried out with market orders, limit orders or whether it contains stop losses etc. Thus it is absolutely essential to replicate the strategy yourself as best you can, backtest it and add in realistic transaction costs that include as many aspects of the asset classes that you wish to trade in.
Here is a list of the more popular pre-print servers and financial journals that you can source ideas from:
What about forming your own quantitative strategies? This generally requires (but is not limited to) expertise in one or more of the following categories:
- Market microstructure - For higher frequency strategies in particular, one can make use of market microstructure, i.e. understanding of the order book dynamics in order to generate profitability. Different markets will have various technology limitations, regulations, market participants and constraints that are all open to exploitation via specific strategies. This is a very sophisticated area and retail practitioners will find it hard to be competitive in this space, particularly as the competition includes large, well-capitalised quantitative hedge funds with strong technological capabilities.
- Fund structure - Pooled investment funds, such as pension funds, private investment partnerships (hedge funds), commodity trading advisors and mutual funds are constrained both by heavy regulation and their large capital reserves. Thus certain consistent behaviours can be exploited with those who are more nimble. For instance, large funds are subject to capacity constraints due to their size. Thus if they need to rapidly offload (sell) a quantity of securities, they will have to stagger it in order to avoid "moving the market". Sophisticated algorithms can take advantage of this, and other idiosyncrasies, in a general process known as fund structure arbitrage.
- Machine learning/artificial intelligence - Machine learning algorithms have become more prevalent in recent years in financial markets. Classifiers (such as Naive-Bayes, et al.) non-linear function matchers (neural networks) and optimisation routines (genetic algorithms) have all been used to predict asset paths or optimise trading strategies. If you have a background in this area you may have some insight into how particular algorithms might be applied to certain markets.
There are, of course, many other areas for quants to investigate. We'll discuss how to come up with custom strategies in detail in a later article.
By continuing to monitor these sources on a weekly, or even daily, basis you are setting yourself up to receive a consistent list of strategies from a diverse range of sources. The next step is to determine how to reject a large subset of these strategies in order to minimise wasting your time and backtesting resources on strategies that are likely to be unprofitable.
Evaluating Trading Strategies
The first, and arguably most obvious consideration is whether you actually understand the strategy. Would you be able to explain the strategy concisely or does it require a string of caveats and endless parameter lists? In addition, does the strategy have a good, solid basis in reality? For instance, could you point to some behavioural rationale or fund structure constraint that might be causing the pattern(s) you are attempting to exploit? Would this constraint hold up to a regime change, such as a dramatic regulatory environment disruption? Does the strategy rely on complex statistical or mathematical rules? Does it apply to any financial time series or is it specific to the asset class that it is claimed to be profitable on? You should constantly be thinking about these factors when evaluating new trading methods, otherwise you may waste a significant amount of time attempting to backtest and optimise unprofitable strategies.
Once you have determined that you understand the basic principles of the strategy you need to decide whether it fits with your aforementioned personality profile. This is not as vague a consideration as it sounds! Strategies will differ substantially in their performance characteristics. There are certain personality types that can handle more significant periods of drawdown, or are willing to accept greater risk for larger return. Despite the fact that we, as quants, try and eliminate as much cognitive bias as possible and should be able to evaluate a strategy dispassionately, biases will always creep in. Thus we need a consistent, unemotional means through which to assess the performance of strategies. Here is the list of criteria that I judge a potential new strategy by:
- Methodology - Is the strategy momentum based, mean-reverting, market-neutral, directional? Does the strategy rely on sophisticated (or complex!) statistical or machine learning techniques that are hard to understand and require a PhD in statistics to grasp? Do these techniques introduce a significant quantity of parameters, which might lead to optimisation bias? Is the strategy likely to withstand a regime change (i.e. potential new regulation of financial markets)?
- Sharpe Ratio - The Sharpe ratio heuristically characterises the reward/risk ratio of the strategy. It quantifies how much return you can achieve for the level of volatility endured by the equity curve. Naturally, we need to determine the period and frequency that these returns and volatility (i.e. standard deviation) are measured over. A higher frequency strategy will require greater sampling rate of standard deviation, but a shorter overall time period of measurement, for instance.
- Leverage - Does the strategy require significant leverage in order to be profitable? Does the strategy necessitate the use of leveraged derivatives contracts (futures, options, swaps) in order to make a return? These leveraged contracts can have heavy volatility characterises and thus can easily lead to margin calls. Do you have the trading capital and the temperament for such volatility?
- Frequency - The frequency of the strategy is intimately linked to your technology stack (and thus technological expertise), the Sharpe ratio and overall level of transaction costs. All other issues considered, higher frequency strategies require more capital, are more sophisticated and harder to implement. However, assuming your backtesting engine is sophisticated and bug-free, they will often have far higher Sharpe ratios.
- Volatility - Volatility is related strongly to the "risk" of the strategy. The Sharpe ratio characterises this. Higher volatility of the underlying asset classes, if unhedged, often leads to higher volatility in the equity curve and thus smaller Sharpe ratios. I am of course assuming that the positive volatility is approximately equal to the negative volatility. Some strategies may have greater downside volatility. You need to be aware of these attributes.
- Win/Loss, Average Profit/Loss - Strategies will differ in their win/loss and average profit/loss characteristics. One can have a very profitable strategy, even if the number of losing trades exceed the number of winning trades. Momentum strategies tend to have this pattern as they rely on a small number of "big hits" in order to be profitable. Mean-reversion strategies tend to have opposing profiles where more of the trades are "winners", but the losing trades can be quite severe.
- Maximum Drawdown - The maximum drawdown is the largest overall peak-to-trough percentage drop on the equity curve of the strategy. Momentum strategies are well known to suffer from periods of extended drawdowns (due to a string of many incremental losing trades). Many traders will give up in periods of extended drawdown, even if historical testing has suggested this is "business as usual" for the strategy. You will need to determine what percentage of drawdown (and over what time period) you can accept before you cease trading your strategy. This is a highly personal decision and thus must be considered carefully.
- Capacity/Liquidity - At the retail level, unless you are trading in a highly illiquid instrument (like a small-cap stock), you will not have to concern yourself greatly with strategy capacity. Capacity determines the scalability of the strategy to further capital. Many of the larger hedge funds suffer from significant capacity problems as their strategies increase in capital allocation.
- Parameters - Certain strategies (especially those found in the machine learning community) require a large quantity of parameters. Every extra parameter that a strategy requires leaves it more vulnerable to optimisation bias (also known as "curve-fitting"). You should try and target strategies with as few parameters as possible or make sure you have sufficient quantities of data with which to test your strategies on.
- Benchmark - Nearly all strategies (unless characterised as "absolute return") are measured against some performance benchmark. The benchmark is usually an index that characterises a large sample of the underlying asset class that the strategy trades in. If the strategy trades large-cap US equities, then the S&P500 would be a natural benchmark to measure your strategy against. You will hear the terms "alpha" and "beta", applied to strategies of this type. We will discuss these coefficients in depth in later articles.
Notice that we have not discussed the actual returns of the strategy. Why is this? In isolation, the returns actually provide us with limited information as to the effectiveness of the strategy. They don't give you an insight into leverage, volatility, benchmarks or capital requirements. Thus strategies are rarely judged on their returns alone. Always consider the risk attributes of a strategy before looking at the returns.
At this stage many of the strategies found from your pipeline will be rejected out of hand, since they won't meet your capital requirements, leverage constraints, maximum drawdown tolerance or volatility preferences. The strategies that do remain can now be considered for backtesting. However, before this is possible, it is necessary to consider one final rejection criteria - that of available historical data on which to test these strategies.
Obtaining Historical Data
Nowadays, the breadth of the technical requirements across asset classes for historical data storage is substantial. In order to remain competitive, both the buy-side (funds) and sell-side (investment banks) invest heavily in their technical infrastructure. It is imperative to consider its importance. In particular, we are interested in timeliness, accuracy and storage requirements. I will now outline the basics of obtaining historical data and how to store it. Unfortunately this is a very deep and technical topic, so I won't be able to say everything in this article. However, I will be writing a lot more about this in the future as my prior industry experience in the financial industry was chiefly concerned with financial data acquisition, storage and access.
In the previous section we had set up a strategy pipeline that allowed us to reject certain strategies based on our own personal rejection criteria. In this section we will filter more strategies based on our own preferences for obtaining historical data. The chief considerations (especially at retail practitioner level) are the costs of the data, the storage requirements and your level of technical expertise. We also need to discuss the different types of available data and the different considerations that each type of data will impose on us.
Let's begin by discussing the types of data available and the key issues we will need to think about:
- Fundamental Data - This includes data about macroeconomic trends, such as interest rates, inflation figures, corporate actions (dividends, stock-splits), SEC filings, corporate accounts, earnings figures, crop reports, meteorological data etc. This data is often used to value companies or other assets on a fundamental basis, i.e. via some means of expected future cash flows. It does not include stock price series. Some fundamental data is freely available from government websites. Other long-term historical fundamental data can be extremely expensive. Storage requirements are often not particularly large, unless thousands of companies are being studied at once.
- News Data - News data is often qualitative in nature. It consists of articles, blog posts, microblog posts ("tweets") and editorial. Machine learning techniques such as classifiers are often used to interpret sentiment. This data is also often freely available or cheap, via subscription to media outlets. The newer "NoSQL" document storage databases are designed to store this type of unstructured, qualitative data.
- Asset Price Data - This is the traditional data domain of the quant. It consists of time series of asset prices. Equities (stocks), fixed income products (bonds), commodities and foreign exchange prices all sit within this class. Daily historical data is often straightforward to obtain for the simpler asset classes, such as equities. However, once accuracy and cleanliness are included and statistical biases removed, the data can become expensive. In addition, time series data often possesses significant storage requirements especially when intraday data is considered.
- Financial Instruments - Equities, bonds, futures and the more exotic derivative options have very different characteristics and parameters. Thus there is no "one size fits all" database structure that can accommodate them. Significant care must be given to the design and implementation of database structures for various financial instruments. We will discuss the situation at length when we come to build a securities master database in future articles.
- Frequency - The higher the frequency of the data, the greater the costs and storage requirements. For low-frequency strategies, daily data is often sufficient. For high frequency strategies, it might be necessary to obtain tick-level data and even historical copies of particular trading exchange order book data. Implementing a storage engine for this type of data is very technologically intensive and only suitable for those with a strong programming/technical background.
- Benchmarks - The strategies described above will often be compared to a benchmark. This usually manifests itself as an additional financial time series. For equities, this is often a national stock benchmark, such as the S&P500 index (US) or FTSE100 (UK). For a fixed income fund, it is useful to compare against a basket of bonds or fixed income products. The "risk-free rate" (i.e. appropriate interest rate) is also another widely accepted benchmark. All asset class categories possess a favoured benchmark, so it will be necessary to research this based on your particular strategy, if you wish to gain interest in your strategy externally.
- Technology - The technology stacks behind a financial data storage centre are complex. This article can only scratch the surface about what is involved in building one. However, it does centre around a database engine, such as a Relational Database Management System (RDBMS), such as MySQL, SQL Server, Oracle or a Document Storage Engine (i.e. "NoSQL"). This is accessed via "business logic" application code that queries the database and provides access to external tools, such as MATLAB, R or Excel. Often this business logic is written in C++, C#, Java or Python. You will also need to host this data somewhere, either on your own personal computer, or remotely via internet servers. Products such as Amazon Web Services have made this simpler and cheaper in recent years, but it will still require significant technical expertise to achieve in a robust manner.
As can be seen, once a strategy has been identified via the pipeline it will be necessary to evaluate the availability, costs, complexity and implementation details of a particular set of historical data. You may find it is necessary to reject a strategy based solely on historical data considerations. This is a big area and teams of PhDs work at large funds making sure pricing is accurate and timely. Do not underestimate the difficulties of creating a robust data centre for your backtesting purposes!
I do want to say, however, that many backtesting platforms can provide this data for you automatically - at a cost. Thus it will take much of the implementation pain away from you, and you can concentrate purely on strategy implementation and optimisation. Tools like TradeStation possess this capability. However, my personal view is to implement as much as possible internally and avoid outsourcing parts of the stack to software vendors. I prefer higher frequency strategies due to their more attractive Sharpe ratios, but they are often tightly coupled to the technology stack, where advanced optimisation is critical.
Now that we have discussed the issues surrounding historical data it is time to begin implementing our strategies in a backtesting engine. This will be the subject of other articles, as it is an equally large area of discussion!
Master Your Setup, Master Your self. (NQoos)
1
- #1,752
- Edited 10:10am Apr 24, 2017 3:25am | Edited 10:10am
- | Commercial User | Joined Apr 2013 | 4,366 Posts
You could spend a lifetime in your blog Bass. Talk about a definitive go to place on this forum mate. :-)
- #1,753
- Edited 8:11am Apr 24, 2017 7:16am | Edited 8:11am
- Joined Apr 2011 | Status: Cut Your Losses, Ride Your Winners. | 2,914 Posts
DislikedYou could spend a lifetime in your blog Bass. Talk about a definive go to place on this forum mate. :-)Ignored
Yes, a lifetime is what you are expected to spend on Learning to become a Quant, i wish i have the personal capacities or the time to become one.
A complete path is mentioned here (If you Have the time to read Through, i know i did) :
Back to Basics: Introduction to Algorithmic Trading
Back to Basics Part 2 How to Succeed at Algorithmic Trading
Back to Basics Part 3: Backtesting in Algorithmic Trading
Cheers,
bass
Master Your Setup, Master Your self. (NQoos)
1
- #1,754
- Apr 26, 2017 7:22am Apr 26, 2017 7:22am
- Joined Apr 2011 | Status: Cut Your Losses, Ride Your Winners. | 2,914 Posts
Worth Seeing :
futures.io Webinars.
Market Analysis and Commentary
Presented by: Dave Forss @ DTN IQFeed, topics include:
Introducing iSystems Automated Trading Strategies
Presented by: Anthony Giacomin @ Stage 5 Trading, topics include:
- Choose from over 650 automated strategies
- Manage your account live from anywhere
- One account can trade many systems
- Backtesting, forward testing, live trading
- State of the art development tools
- Free for developers including market data
Machine Learning & Data Mining Bias
Presented by: Kris Longmore @ Robot Wealth, topics include:
- Brief introduction to machine learning in a trading context
- The big obstacles to making it work
- Practical advice for surmounting those obstacles
- Data mining bias: what it is, why it is dangerous, what to do about it
- Questions and Answers
And a Huge Free Webinars Library For Elite Members .
Master Your Setup, Master Your self. (NQoos)
- #1,755
- Apr 27, 2017 1:26am Apr 27, 2017 1:26am
- Joined Apr 2011 | Status: Cut Your Losses, Ride Your Winners. | 2,914 Posts
The Holy Grail Of Research right at your Fingertips .
Meyers Analytics
Meyers Analytics
Master Your Setup, Master Your self. (NQoos)
- #1,756
- Apr 27, 2017 1:54am Apr 27, 2017 1:54am
- | Commercial User | Joined Apr 2013 | 4,366 Posts
- #1,757
- Apr 27, 2017 2:48am Apr 27, 2017 2:48am
- Joined Apr 2011 | Status: Cut Your Losses, Ride Your Winners. | 2,914 Posts
He was a Major Contributor on TSD and now moved on to his personal site and FF.
https://www.forex-station.com/index.php
Enjoy .
Master Your Setup, Master Your self. (NQoos)
1
- #1,758
- May 2, 2017 7:54am May 2, 2017 7:54am
- Joined Apr 2011 | Status: Cut Your Losses, Ride Your Winners. | 2,914 Posts
Back to Basics Part 3: Backtesting in Algorithmic Trading
Posted on April 12, 2017 by Kris Longmore
Nearly all research related to algorithmic trading is empirical in nature. That is, it is based on observations and experience. Contrast this with theoretical research which is based on assumptions, logic and a mathematical framework. Often, we start with a theoretical approach (for example, a time-series model that we assume describes the process generating the market data we are interested in) and then use empirical techniques to test the validity of our assumptions and framework. But we would never commit money to a mathematical model that we assumed described the market without testing it using real observations, and every model is based on assumptions (to my knowledge no one has ever come up with a comprehensive model of the markets based on first principles logic and reasoning). So, empirical research will nearly always play a role in the type of work we do in developing trading systems.
So why is that important?
Empirical research is based on observations that we obtain through experimentation. Sometimes we need thousands of observations in order to carry out an experiment on market data, and since market data arrives in real time, we might have to wait a very long time to run such an experiment. If we mess up our experimental setup or think of a new idea, we would have to start the process all over again. Clearly this is a very inefficient way to conduct research.
A much more efficient way is to simulate our experiment on historical market data using computers. In the context of algorithmic trading research, such a simulation of reality is called a backtest. Backtesting allows us to test numerous variations of our ideas or models quickly and efficiently and provides immediate feedback on how they might have performed in the past. This sounds great, but in reality, backtesting is fraught with difficulties and complications, so I decided to write an article that I hope illustrates some of these issues and provides some guidance on how to deal with them.
Why Backtest?
Before I get too deeply into backtesting theory and its practical application, let’s back up and talk about why we might want to backtest at all. I’ve already said that backtesting allows us to carry out empirical research quickly and efficiently. But why do we even need to do that? Everyone knows that we should just buy when the Relative Strength Index drops below 30, right?
OK, so that was obviously a rhetorical question. But I just wanted to highlight one of the subtly dangerous modes of thinking that can creep in if we are not careful. Now, I know that for the vast majority of Robot Wealth readers, I am preaching to the converted here, but over the last couple of years I’ve worked with a lot of individuals who have come to trading from non-mathematical or non-scientific backgrounds who struggle with this very issue, sometimes unconsciously. This is a good place to address it, so here goes.
In the world of determinism (that is, well-defined cause and effect), natural phenomena can be represented by tractable, mathematical equations. Engineers and scientists reading this will be well-versed for example in Newton’s laws of motion. These laws quantify a physical consequence given a set of initial conditions and are solvable by anyone with a working knowledge of high school level mathematics. The markets however are not deterministic (at least not in the sense that the information we can readily digest describes the future state of the market). That seems obvious, right? The RSI dropping below 30 does not portend an immediate price rise. And if price were to rise, it didn’t happen because the RSI dropped below 30. Sometimes prices will rise following this event, sometimes they will fall and sometimes they will do nothing. We can never tell for sure, and often we can’t describe the underlying cause, beyond more people buying than selling. Most people can accept that fact. However, I have observed time and again a paradox: namely, that the same person who accepts that markets are not deterministic will believe in a set of trading rules because they read them in a book or on the internet.
I have numerous theories about why this is the case, but one that stands out is that it is simply easy to believe things that are nice to believe. Human nature is like that. This particular line of thinking is extraordinarily attractive because it implies that if you do something (simple) over and over again, you will make a lot of money. But that’s a dangerous trap to fall into. And you can even fall into it if your rational self knows that the markets are not deterministic, but you don’t question the assumptions underlying that trading system you read about.
I’m certainly not saying that all DIY traders fall into this trap, but I have noticed it on more than a few occasions. If you’re new to this game, or you’re struggling to be consistently profitable, maybe this is a good thing to think about.
I hope it is clear now why backtesting is important. Some trading rules will make you money; most won’t. But the ones that do make money don’t work because they accurately describe some natural system of physical laws. They work because they capture a market characteristic that over time produces more profit than loss. You never know for sure if a particular trade is going to work out, but sometimes you can conclude that in the long run, your chances of coming out in front are pretty good. Backtesting on past data is the one tool that can help provide a framework in which to conduct experiments and gather information that supports or detracts from that conclusion.
Simulation versus Reality
You might have noticed that in the descriptions of backtesting above I used the words simulation of reality and how our model might have performed in the past. These are very important points! No simulation of reality is ever exactly the same as reality itself. Statistician George Box famously said “All models are wrong, but some are useful” (Box, 1976). It is critical that our simulations be accurate enough to be useful. Or more correctly, we need our simulations to be fit for purpose, after all, a simulation of a monthly ETF rotation strategy may not need all the bells and whistles of a simulation of high frequency statistical arbitrage trading. The point is that any simulation must be accurate enough that it supports the decision-making process for a particular application, and by “decision making process” I mean the decisions around allocating to a particular trading strategy.
So how do we go about building a backtesting environment that we can use as a decision-support tool? Unfortunately, backtesting is not a trivial matter and there are a number of pitfalls and subtle biases that can creep in and send things haywire. But that’s OK, in my experience the people who are attracted to algorithmic trading are usually up for a challenge!
At its most simple level, backtesting requires that your trading algorithm’s performance be simulated using historical market data, and the profit and loss of the resulting trades aggregated. This sounds simple enough, but in practice it is incredibly easy to get inaccurate results from the simulation, or to contaminate it with bias such that it provides an extremely poor basis for making decisions. Dealing with these two problems requires that we consider:
- The accuracy of our simulation; and
- Our experimental methodology and framework for drawing conclusions from its results
Both these aspects need to be considered in order to have any level of confidence in the results of a backtest. I can’t emphasize enough just how important it is to ensure these concepts are taken care of adequately; compromising them can invalidate the results of the experiment. Most algorithmic traders spend vast amounts of time and effort researching and testing ideas and it is a tragic waste of time if not done properly. The next sections explore these concepts in more detail.
Simulation Accuracy
If a simulation is not an accurate reflection of reality, what value is it? Backtests need to be as true a reflection of real trading as necessary to make them fit for their intended purpose. In theory, they should generate the very same trades with the same results as live trading the same system during the same time period.
In order to understand the accuracy of a backtest, you need to understand how the results are simulated and what the limitations of the simulation are. The reality is that no model can precisely capture the phenomena being simulated, but it is possible to build a model that is useful for its intended purposes. It is imperative that we create models that are as accurate a reflection of reality as possible, but equally that we are aware of the limitations. Even the most realistic backtesting environments have limitations.
Backtesting accuracy can be affected by:
- The parameters that describe the trading conditions (spread, slippage, commission, swap) for individual brokers or execution infrastructure. Most brokers or trading setups will result in different conditions, and conditions are rarely static. For example, the spread of a market (the difference between the prices at which the asset can be bought and sold) changes as buyers and sellers submit new orders and amend old ones. Slippage (the difference between the target and actual prices of trade execution) is impacted by numerous phenomena including market volatility, market liquidity, the order type and the latency inherent in the trade execution path. The method of accounting for these time-varying trading conditions can have a big impact on the accuracy of a simulation. The most appropriate method will depend on the strategy and its intended use. For example, high-frequency strategies that are intended to be pushed to their limits of capacity would benefit from modelling the order book for liquidity. That approach might be overkill for a monthly ETF rotation strategy being used to manage an individual’s retirement savings.
- The granularity (sampling frequency) of the data used in the simulation, and its implications. Consider a simulation that relies on hourly open-high-low-close (OHLC) data. This would result in trade entry and exit parameters being evaluated on every hour using only four data points from within that hour. What happens if a take profit and a stop loss were evaluated as being hit during the same OHLC bar? It isn’t possible to know which one was hit first without looking at the data at a more granular level. Whether this is a problem will depend on the strategy itself and its entry and exit parameters.
- The accuracy of the data used in the simulation. No doubt you’ve head the modelling adage “Garbage in, garbage out.” If a simulation runs on poor data, obviously the accuracy of the results will deteriorate. Some of the vagaries of data include the presence of outliers or bad ticks, missing records, misaligned time stamps or wrong time zones, and duplicates. Financial data can have its own unique set of issues too. For example, stock data may need to be adjusted for splits and dividends. Some data sets are contaminated with survivorship bias, containing only stocks that avoided bankruptcy and thus building in an upward bias in the aggregate price evolution. Over-the-counter products, like forex and CFDs, can trade at different prices at different times depending on the broker. Therefore a data set obtained from one source may not be representative of the trade history of another source. Again, the extent to which these issues are problems depends on the individual algorithm and its intended use.
The point of the above is that the accuracy of a simulation is affected by many different factors. These should be understood in the context of the strategy being simulated and its intended use so that sensible decisions can be made around the design of the simulation itself. Just like any scientific endeavour, the design of the experiment is critical to the success of the research!
As a practical matter, it is usually a good idea to check the accuracy of your simulations before deploying them to their final production state. This can be done quite easily by running the strategy live on a small account for some period of time, and then simulating the strategy on the actual market data on which it was run. Regardless of how accurate you thought your simulator was, you will likely see (hopefully) small deviations between live trading and simulated trading, even when the same data is being used. Ideally the deviations will be within a sensible tolerance range for your strategy, that is, a range that does not significantly alter your decisions around allocating to the strategy. If the deviations do cause you to rethink a decision, then the simulator was likely not accurate enough for its intended purpose.
Development Methodology
In addition to simulation accuracy, the experimental methodology itself can compromise the results of our simulations. Many of these biases are subtle yet profound: they can and will very easily creep into a trading strategy research and development process and can have disastrous effects on live performance. Accounting for these biases is critical and needs to be considered at every stage of the development process.
Robot Wealth’s course Fundamentals of Algorithmic Trading details a workflow that you can adopt to minimize these effects as well as an effective method of maintaining records which will go a long way to helping identify and minimize bias in its various forms. For now, I will walk through and explain the various biases that can creep in and their effect on a trading strategy. For a detailed discussion of these biases and a highly interesting account of the psychological factors that make accounting for these biases difficult, refer to David Aronson’s Evidence Based Technical Analysis (2006).
Look-Ahead Bias, Also Known As Peeking Bias
This form of bias is introduced by allowing future knowledge to affect trade decisions. That is, trade decisions are affected by knowledge that would not have been available at the time the trade decision was taken. A good simulator will be engineered to prevent this from happening, it is surprisingly easy to allow this bias to creep in when designing our own backtesting tools. A common example is executing an intra-day trade on the basis of the day’s closing price, when that closing price is not actually known until the end of the day.
When using custom-built simulators, you will find that you will typically need to give this bias some attention. I commonly use the statistical package R and the Python programming language for various modelling and testing purposes and when I do, I find that I need to consider this bias in more detail. On the positive side, it is easy to identify when a simulation doesn’t properly account for it, because the resulting equity curve will typically look like the one shown below, since it is easy to predict an outcome if we know about the future!
https://i2.wp.com/robotwealth.com/wp...size=748%2C414Another way this bias can creep in more subtly is when we use an entire simulation to calculate a parameter and then retrospectively apply it to the beginning of the next run of the simulation. Portfolio optimization parameters are particularly prone to this bias.
Curve-Fitting Bias, Also Known As Over-Optimization Bias
This is the bias that allows us to create magical backtests that produce annual returns on the order of hundreds of percent. Such backtests are of course completely useless for any practical trading purpose.
The following plots show curve-fitting in action. The blue dots are an artificially generated linear function with some noise added to distort the underlying signal. It has the form y=mx+b+ϵ where ϵ is noise drawn from a normal distribution, and we have 20 points in our data set. Regression models of varying complexity were fit to the first 10 points of the data set (the in-sample set) and these models were tested against the unseen data consisting of the remaining 10 points not used for model building (the out-of-sample set). You can see that as we increase the complexity of the model, we get a better fit on the in-sample data, but the out-of-sample performance deteriorates drastically. Further, the more complex the model, the worse the deterioration out of sample.
https://i0.wp.com/robotwealth.com/wp...size=748%2C748
The more complex models are actually fitting to the noise in the data rather than the signal, and since noise is by definition random, the models that predict based on what they know about the in-sample noise perform horrendously out-of-sample. When we fit a trading strategy to an inherently noisy data set (and financial data is extremely noisy), we run the risk of fitting our strategy to the noise, and not to the underlying signal. The underlying signal is the anomaly or price effect that we believe provides profitable trading opportunities, and this signal is what we are actually trying to capture with our model. If we fit our model to the noise, we will essentially end up with a random trading model, which of course is of little use to anyone, except perhaps your broker.
Data-Mining Bias, Also Known As Selection Bias
Data mining bias is another significant source of over-estimated model performance. It takes a number of forms and is largely unavoidable – therefore rather than eliminating it completely, we need to be aware of it and take measures to account for it. Most commonly, you will introduce it when you select the best performer from a number of possible algorithms, algorithm variants, variables or markets to take forward with your development process. If you try enough strategies and markets, you will eventually (relatively often actually) find one that performs well due to luck alone.
For example, say you develop a trend following strategy for the forex markets. The strategy does exceptionally well in its backtest on the EUR/USD market, but fails on the USD/JPY market. By selecting to trade the EUR/USD market, you have introduced selection bias into your process, and the estimate of the strategy’s performance on the EUR/USD market is now upwardly biased. You must either temper your expectations from the strategy, or test it on a new, unseen sample of EUR/USD data and use that result as your unbiased estimate of performance.
It is my experience that beginners to algorithmic trading typically suffer more from the effects of curve-fitting bias during the early stage of their journey. That may be because these effects tend to be more obvious and intuitive. Selection bias on the other hand can be just as severe as curve-fitting bias, but is not as intuitively easy to understand. A common mistake is to test multiple variants of a strategy on an out-of-sample data set and then select the best one based on the out-of-sample performance. While this is not necessarily a mistake per se, the mistake is treating the performance of the selected variant in the out-of-sample period as an unbiased estimate of future performance. This may not be the end of the world if only a small number of variants were compared, but what if we looked at hundreds or even thousands of different variants, as we might do if were using machine learning methods? Surely among hundreds of out-of-sample comparisons, at least one would show a good result by chance alone? In that case, how can we have confidence in our selected strategy?
This begs the question of how to account for this data-mining bias effect. In practical terms, you will quickly run into difficulty if you try to test your strategy on new data after each selection or decision point since the amount of data at your disposal is finite. Other methods to account for data mining bias include comparing the performance of the strategy with a distribution of random performances, White’s Reality Check and its variations, and Monte Carlo Permutation Tests.
Conclusion
This final Back to Basics article described why we take an experimental approach to algorithmic trading research and detailed the main barriers to obtaining useful, accurate and meaningful results from our experiments. A robust strategy is one that exploits real market anomalies, inefficiencies, or characteristics, however it is surprisingly easy to find strategies that appear robust in a simulator, but whose performance turns out to be due to inaccurate modelling, randomness or one of the biases described above. Clearly, we need a systematic approach to dealing with each of these barriers and ideally a workflow with embedded tools, checks and balances that account for these issues. I would go as far to say that in order to do any serious algorithmic trading research, or at least to do it in an efficient and meaningful way, we need a workflow and a research environment that addresses each of the issues detailed in this article. That’s exactly what we provide in Fundamentals of Algorithmic Trading, which was written in order to teach new or aspiring algorithmic traders how to operate the tools of the trade, and even more importantly, how to operate them effectively via such a workflow. If you would like to learn such a systematic approach to robust strategy development, head over to the Courses page to find out more.
Master Your Setup, Master Your self. (NQoos)
1
- #1,759
- Edited May 4, 2017 7:49am May 3, 2017 7:52am | Edited May 4, 2017 7:49am
- Joined Apr 2011 | Status: Cut Your Losses, Ride Your Winners. | 2,914 Posts
Every single Machine Learning course on the internet, ranked by your reviews
The Turtle system: Forex performance analysis
Weekly trend prediction : An adaptive breakout technique analysis
Walk-forward analysis of a volatility breakout system
Keltner Channel volatility breakouts
Edge-ratio strategy design
The Turtle system: Forex performance analysis
Weekly trend prediction : An adaptive breakout technique analysis
Walk-forward analysis of a volatility breakout system
Keltner Channel volatility breakouts
Edge-ratio strategy design
Master Your Setup, Master Your self. (NQoos)
1
- #1,760
- May 5, 2017 5:05am May 5, 2017 5:05am
- Joined Apr 2011 | Status: Cut Your Losses, Ride Your Winners. | 2,914 Posts
Master Your Setup, Master Your self. (NQoos)