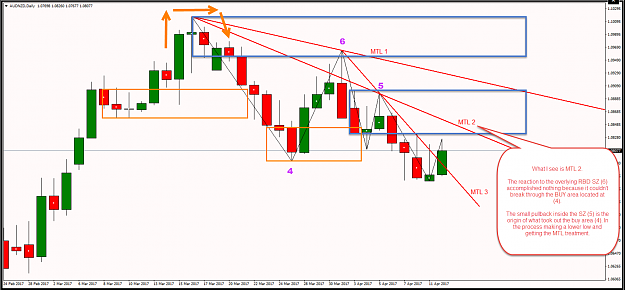
Hello All, I had difficulties in drawing a MTL in daily AUDNZD chart...See attached 3 possible ways I see to draw it. Which one is the correct way to draw it? Thanks. {image}
I understood that I have to join last two lower highs what made lower low than previous high. For me it looks that you have an additional rule - lower high has to take out a SZ (or previous high SZ). Is it correct?
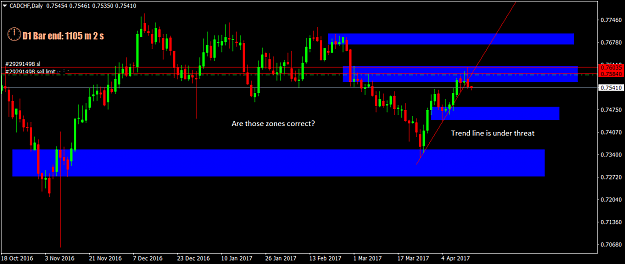
Im very new to supply and demand trading. Practicing on demo, mostly D, 4h and 1h....however Im dabbling on shorter TF for E/U. Trying to contribute to the thread....any feedback is appreciated. Ezzy {image}
Ignored
Dear Ezzy,
I am happy that you are interested in S/D trading. I recommend you to watch Akt's YouTube videos - BACK TO BASICS and other analysis trades. Here is the LINK. There you will get basic knowledge about TREND, MOMENTUM TREND LINE, MULTIPLE TIME FRAME ANALYSIS ETC. Denden has great videos as well. Recomend to watch BACK TESTING VIDEO. LINK to his channel.
Your showed charts missing Mom TL and description of each time frame and zones (I am saying that, because it helps others and mostly it will help yourself. Yes! Tanking with myself about possible trade helps. ). Only than traders can better help you. I recommend to watch those videos and then add missing things on chart.
Hello traders,
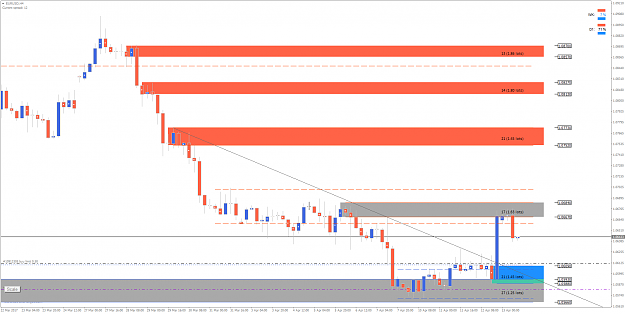
I am thinking to take a long position on EUR/USD. Hope for comments.
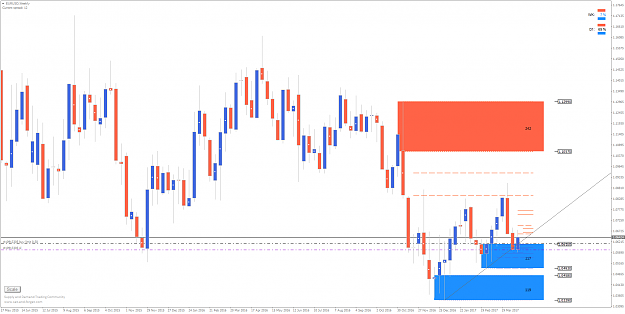
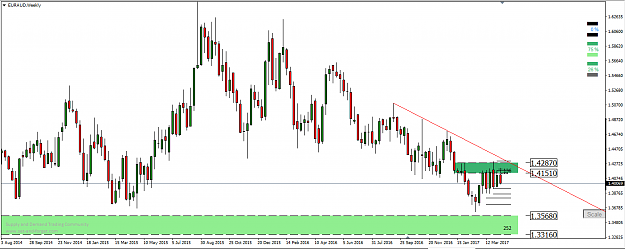
Weekly: Trend is up, Mom TL is up, price is rallying up from fresh DZ.
Attached Image (click to enlarge)
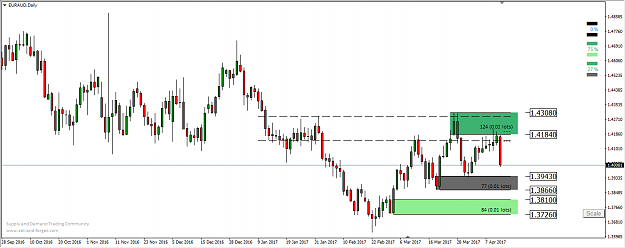
Daily: Trend is consolidating, downward Mom TL is broken, price tested slightly tested SZ and is approaching fresh DZ made by Mom TL nested at the top of weekly DZ.
Attached Image (click to enlarge)
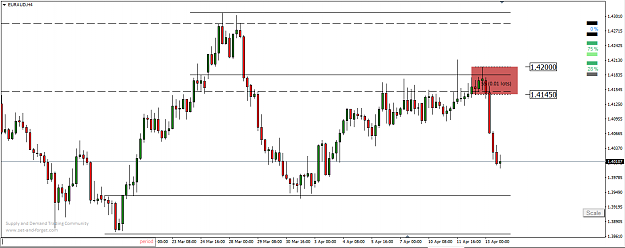
H4: Trend is consolidating, downward Mom TL is broken, price tested fresh SZ more than 50% and is approaching to fresh DZ made by Mom TL at the top of daily and weekly DZ.
{quote} Dear Denis, I understood that I have to join last two lower highs what made lower low than previous high. For me it looks that you have an additional rule - lower high has to take out a SZ (or previous high SZ). Is it correct? Best wishes,
Ignored
Just my opinion.
MTL1 is traditional technical analysis way of drawing trend lines. They are looking for pivot highs and pivot lows. In that context, MTL1 is correct.
MTL2 is SaD way of drawing momentum lines (or trendline) we are looking for SaD zones being created and removed and in the process if a LL (in this case) is created then you connect the ML. Key here is go back to Supply and Demand zones and see if they manage to break opposing zones.
MTL3 is more aggressive version of traditional TA analysis and how they draw trendlines.
{quote} Just my opinion. MTL1 is traditional technical analysis way of drawing trend lines. They are looking for pivot highs and pivot lows. In that context, MTL1 is correct. MTL2 is SaD way of drawing momentum lines (or trendline) we are looking for SaD zones being created and removed and in the process if a LL (in this case) is created then you connect the ML. Key here is go back to Supply and Demand zones and see if they manage to break opposing zones. MTL3 is more aggressive version of traditional TA analysis and how they draw trendlines.
Ignored
Thanks Denden2012 for the helpful insight. I very much appreciate it sir.
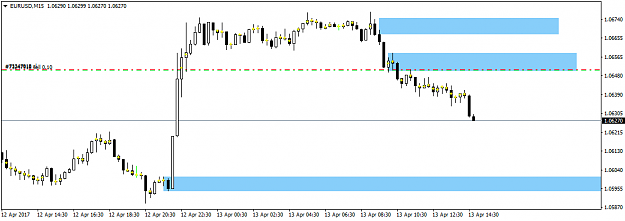
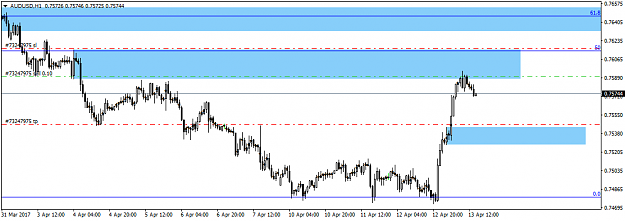
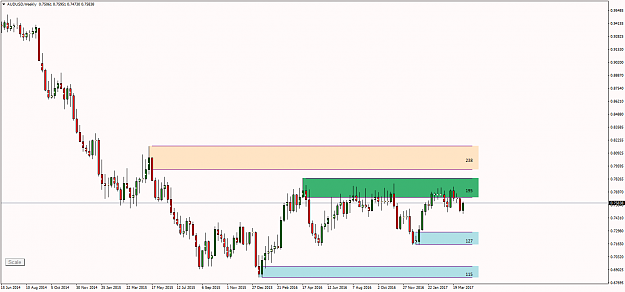
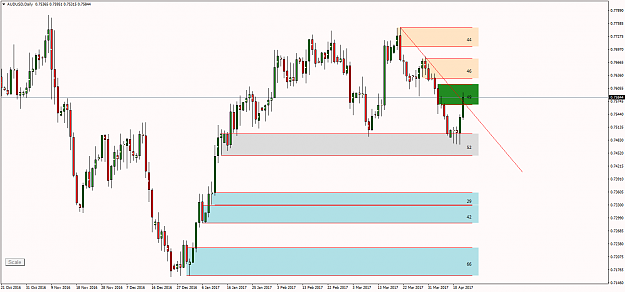
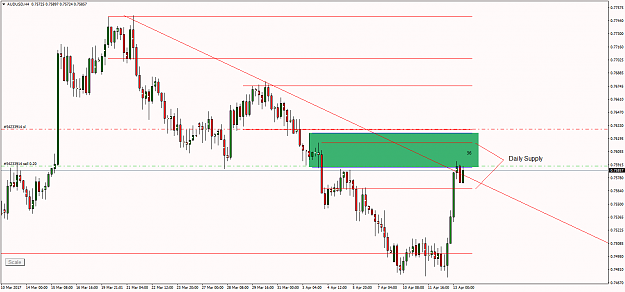
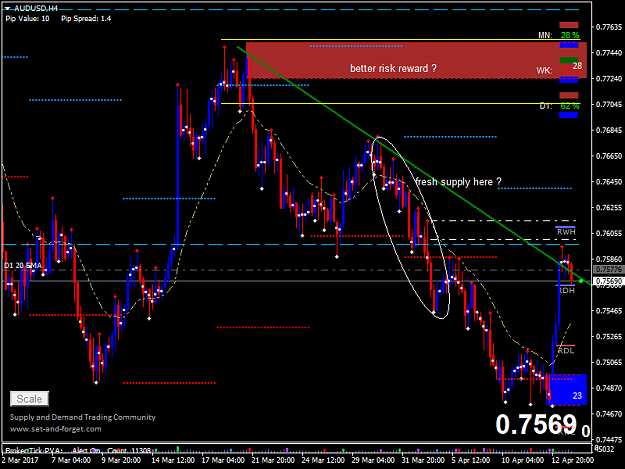
Hello All, Short AUDUSD. Wait for few days for price to come back to the daily SZ then today I took the trade at H4 TF. Please comment as you wish....I am here to learn. W1 Curve: {image} D1 Momentum: {image} H4 Entry: {image}
{quote} Just my opinion. MTL1 is traditional technical analysis way of drawing trend lines. They are looking for pivot highs and pivot lows. In that context, MTL1 is correct. MTL2 is SaD way of drawing momentum lines (or trendline) we are looking for SaD zones being created and removed and in the process if a LL (in this case) is created then you connect the ML. Key here is go back to Supply and Demand zones and see if they manage to break opposing zones. MTL3 is more aggressive version of traditional TA analysis and how they draw trendlines.
Ignored
Hello Denden2012. Thanks for your great help to us. I am confused about "MTL3 is more aggressive version of traditional TA analysis and how they draw trendlines". Can you please tell us a little more.
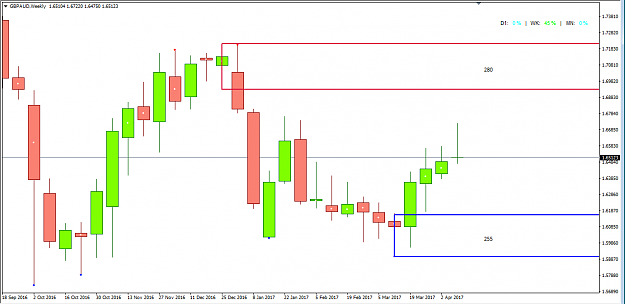
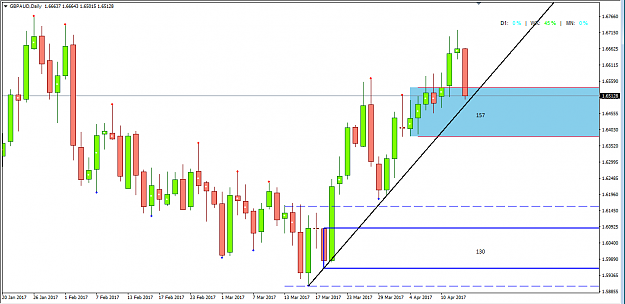
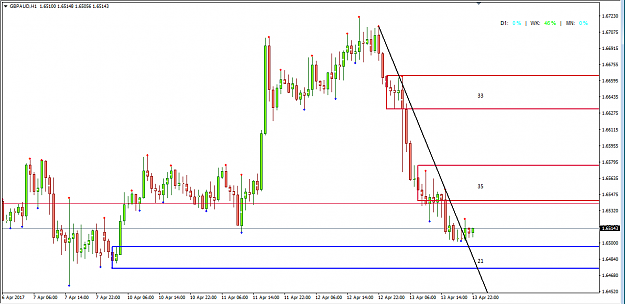
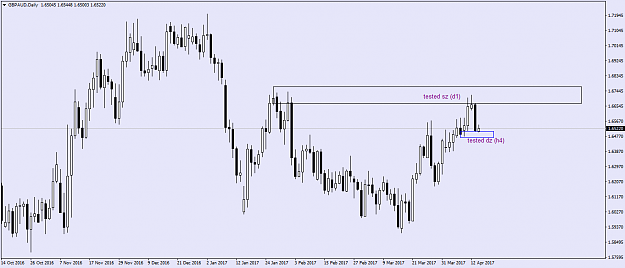
GBPAUD (Long) - TDA Weekly - Curve (Middle) {image} Daily - Trend (Up) / Momentum line (Up) {image} H1 - Entry (Nested DZ or new DZ after break of down momentum line) {image} First time I am doing this kind of TDA actually, don't know if I am wide off the mark.
Ignored
"The markets can remain irrational longer than you can remain solv
{quote} Just my opinion. MTL1 is traditional technical analysis way of drawing trend lines. They are looking for pivot highs and pivot lows. In that context, MTL1 is correct. MTL2 is SaD way of drawing momentum lines (or trendline) we are looking for SaD zones being created and removed and in the process if a LL (in this case) is created then you connect the ML. Key here is go back to Supply and Demand zones and see if they manage to break opposing zones. MTL3 is more aggressive version of traditional TA analysis and how they draw trendlines.
Ignored
Thanks for this Denis.
best wishes
Be careful what you think because your thoughts run your life..Solomon