Good Day
Hope everyone is doing well.
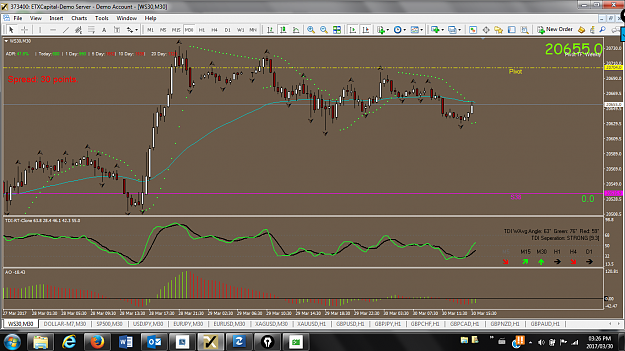
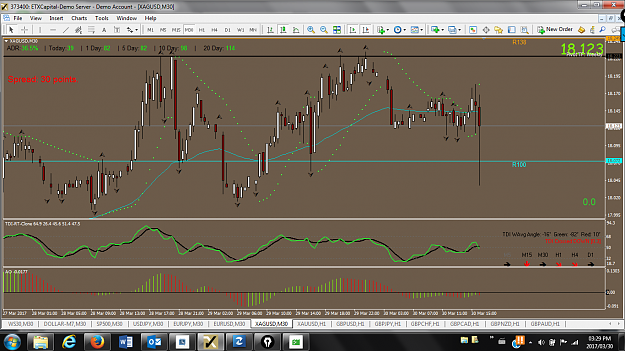
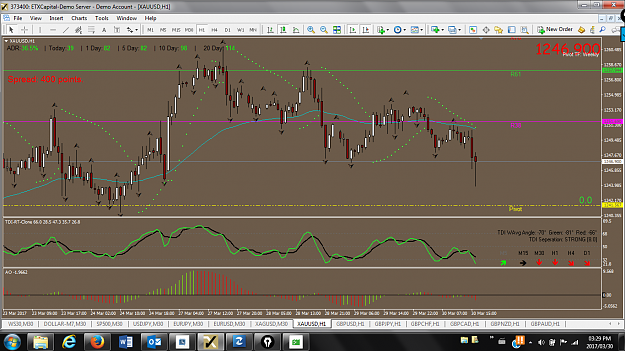
Here are the charts.

Hope everyone is doing well.
Here are the charts.
Attached Image(s) (click to enlarge)
Whats your best money management method? 52 replies
How to flow with the order flow? 26 replies
Money Management / Risk Management 24 replies
Money management model for multiple strategy trading method 16 replies
Most popular money management method. 7 replies
Dislikedhttps://www.armstrongeconomics.com/m...to-the-upside/ Are we On the Verge of a Market Explosion to the Upside? Tomorrow we end the first quarter of 2017. Politics on a global scale are the driving force. The failure of Trump and reform movements in Europe are the catalyst to send the stock market to record highs once again as people lose confidence in government completely and we then turn to just look how to park money. We cross that line moving beyond the...Ignored
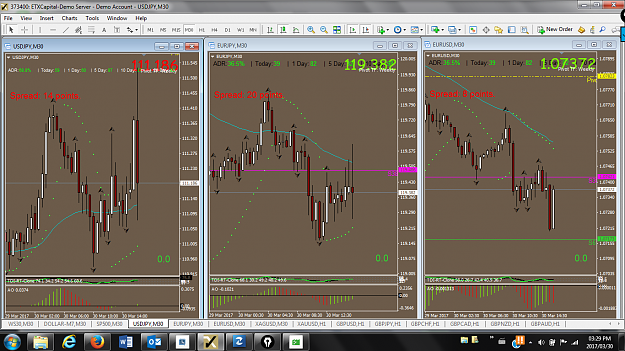
DislikedI just closed two shorts on USDJPY does anyone know what just happened --- I did not expect the sharp move down just now. Made a lot of pips but can see no fundamental reason for it. Was it the NY futures open in NY --9:30 EST ?? Update--- Thank you keepcalmfx for your reply. I think it was a combo of unemployment numbers and the consumer comfort but had to wait for the volume to come in and take EU up and UJ down. volume = NY open... something that Benj has spoken about often. must pay attention to stay in the right direction.Ignored
Q4 profits, at a seasonally adjusted annual rate, but not adjusted for inflation, were back where they’d been in Q1 2012:
http://wolfstreet.com/wp-content/upl...-after-tax.png
By this measure, corporate profits have been in a volatile five-year stagnation. However, during that time – since Q1 2012 – the S&P 500 index has soared 70%.
It’s hard to blame oil: The price didn’t start collapsing until the fall of 2014. Earnings didn’t get hit until 2015. By mid-2016, oil was recovering. These dynamics have influenced the V-shaped drop and rise in 2015 and 2016. But the stagnation in the two prior years occurred when WTI was trading above $100 and occasionally above $110 a barrel!
The chart also shows that there were two prior multi-year periods of profit stagnation and even decline while the stock market experienced a massive run-up: from 1996 through 2000, leading to the dotcom crash; and from 2005 through 2008, which ended in the Financial Crisis.
This peculiar phenomenon – soaring stock prices during years of flat or declining profits – is now repeating itself. The end point of the prior two episodes was a lot of bloodletting in the markets that then refocused companies – the survivors – on what they needed to do to make money. For a little while at least, it focused executives on productive activities, rather than on financial engineering, M&A, and similar lofty projects. And it showed in their profits.
But that’s not happening now. Instead, executives are chasing after deals and paying record premiums to acquire other companies. And even data-provider Dealogic blamed stock market “exuberance” for driving merger valuations and premiums that have “soared to the highest level on record.” Read…. Why Does Pre-Collapse Year 2007 Keep Popping Up in M&A?
Post navigation
← Here’s Why Italy’s Banking Crisis Has Gone Off the Radar
Comments From Benjaminis: Good Evening...
DislikedHello Teek I just woke up and read your very personal post. I have great affection and respect for you. One day I will share some common experiences about what happened in the infamous EUR/USD thread. In the meantime to continue with my thoughts I started this post by using the word affection before respect and I will explain. You are a good decent man that is strong willed and caring and giving. In our upside down world the haters and the NMA (Negative Mental Attitude} people have taken over for awhile. Victims and I have no disrespect for real...Ignored