{quote} Very thanks. I'm glad to share my thoughts Regards! All the best!
Ignored
this Thread is awesome its the first time i see a million dollar account.
this is cool bro wish you the best
im still a newbie trader and looking for 30 dollars to start trading on real account
I'm really interested in this simple method. In some cases I was confused to decide the right direction of market and I think the fundamental experience is your guide in these situations , am I right?
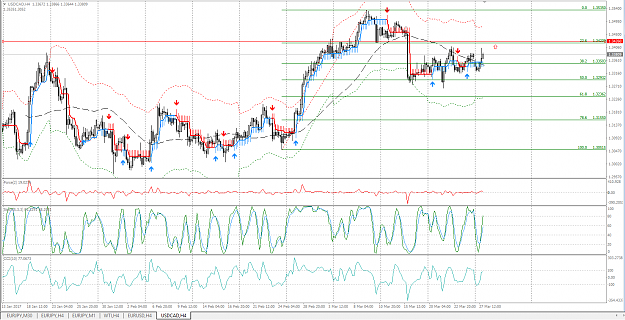
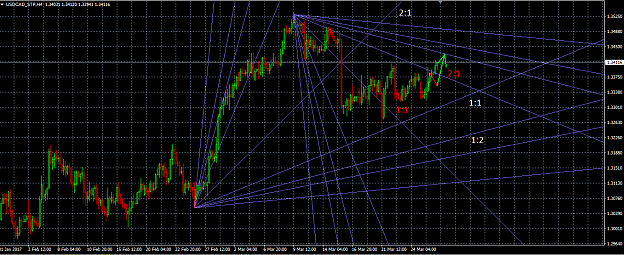
My forecast for USD/CAD for today. I think that the price will be near the level of 1.3386, after which a turn is likely. If the price goes down after touching 1.3386, then I predict a decrease to a minimum of 1:1 fan. If the level of 1.3386 is broken above, then the price can reach 1.3426 or even 1.3500. My opinion is that a correction is forming, approximately resembling a triangle. Therefore, one should expect a volatile movement after narrowing the amplitude of correction oscillations. {image} {image}
Ignored
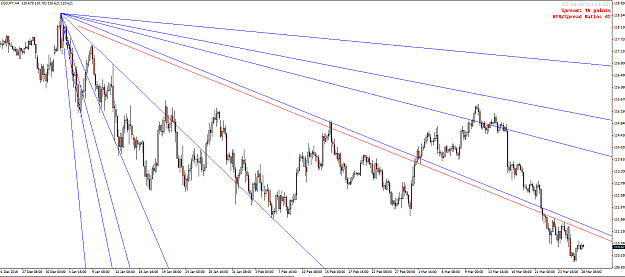
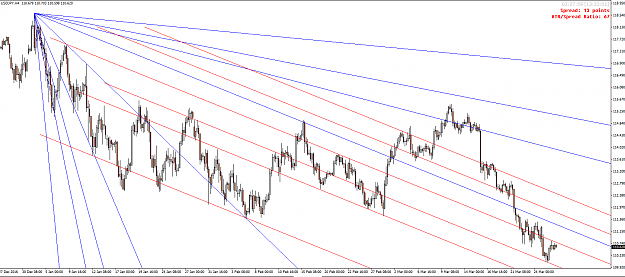
Would you please explain the end point of Gann Fan in this chart... The start point is clear in both of them but I can't find any peak in 1:1 direction as end point.....thanks
{quote} Would you please explain the end point of Gann Fan in this chart... The start point is clear in both of them but I can't find any peak in 1:1 direction as end point.....thanks
Ignored
You should draw a Gann fan at a 45' angle from the peak or low and then align the 1:1 angle with your 45' trend line. Hope that helps.
{quote} Thanks for answer... I got it... then when we use 45' and when we connect 2 peaks?
Ignored
Welcome!
There're two ways to build a fan. One of them really is to stretch it between two peaks. But in this case, you can see the levels of support - resistance (like Fibonacci). But if you adhere to the degree of 45, you can see the reversal level of the trend 1:1. The probability of a turn of the movement significantly grows when the price touches and breach it, and vice versa. I most often use the angle of 45 degrees. For me it's more informative.
My forecast for USD/CAD for today. I think that the price will be near the level of 1.3386, after which a turn is likely. If the price goes down after touching 1.3386, then I predict a decrease to a minimum of 1:1 fan. If the level of 1.3386 is broken above, then the price can reach 1.3426 or even 1.3500. My opinion is that a correction is forming, approximately resembling a triangle. Therefore, one should expect a volatile movement after narrowing the amplitude of correction oscillations. {image} {image}
Ignored
I like ur predictions.... its so close to my Fibonacci retrenchment lines at 1.34200 (23.6%)
Attached Image (click to enlarge)
Trading strategies is like a recipe, right ingredients and you cook great!
{quote} I like ur predictions.... its so close to my Fibonacci retrenchment lines at 1.34200 (23.6%) {image}
Ignored
Thanks.
Looks pretty good. You correctly predicted. If the level of 23.6 is breached, I assume that the growth will continue to 1.35400
I'm still waiting for growth. I have long on USD/CAD...
{quote} Welcome! There're two ways to build a fan. One of them really is to stretch it between two peaks. But in this case, you can see the levels of support - resistance (like Fibonacci). But if you adhere to the degree of 45, you can see the reversal level of the trend 1:1. The probability of a turn of the movement significantly grows when the price touches and breach it, and vice versa. I most often use the angle of 45 degrees. For me it's more informative.
Ignored
You mean a test? Without breakout in the close? just the high or the low break?
A question related to fans... do you use parallel lines? I see they have potential for high probability turning points.
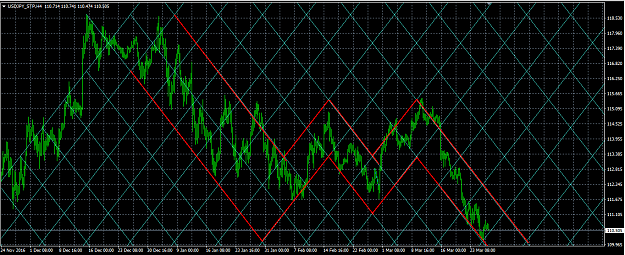
Do you think this is a valid fan? I don't use them usually, I use Median Lines, but Allan Andrews, the inventor of them, used Gann fans also. I tryed in the past with no luck, maybe you are what I was waiting for learning...
Attached Image (click to enlarge)
Example of parallel lines framing the market in an ordered way:
{quote} You mean a test? With a without breakout in the close? just the high or the low break?
Ignored
If the price breaks through the level of 1:1 and lingers there for some time, then the probability of a reversal grows. If there's only a touch, then it can only be testing a 1:1 level.
The forecast continues to come true. I expect growth to 1.34300. But I don't rule out testing the 2: 1 level (red). Break 1.34000 is still imaginary {image}
Ignored
freaking awsome!! i expect it to first come down, then progress more up in the next day to two...
Trading strategies is like a recipe, right ingredients and you cook great!
{quote} If the price breaks through the level of 1:1 and lingers there for some time, then the probability of a reversal grows. If there's only a touch, then it can only be testing a 1:1 level.
{quote} You mean a test? Without breakout in the close? just the high or the low break? A question related to fans... do you use parallel lines? I see they have potential for high probability turning points. Do you think this is a valid fan? I don't use them usually, I use Median Lines, but Allan Andrews, the inventor of them, used Gann fans also. I tryed in the past with no luck, maybe you are what I was waiting for learning... {image} Example of parallel lines framing the market in an ordered way: {image}
Ignored
No, I don't use such lines, as shown in the picture. But I often use Gann's grid. It forms a grid, which is a line of support and resistance.
God bless you sir for sharing your knowledge so kindly. Please excuse me if u have mentioned already, but could you tell us how to accurately plot the gann fans on the metatrader chart. The problem is when I plot 45 degrees from the low/high, that trend line tends to move to different areas on the chart wen I move the chart backwards and forth