DislikedHello everybody, I know I have been away for a while but duty called (military deployment) but I have been following the forum and watching all the videos from Damian! (thank you again for that sir). Anyways I finally got a live account going with small deposit just to have a feel of trading for real money instead of demo trading, which I've been doing now for a while. Because of my work schedule I have decided that it was best for me to trade the higher timeframes (normally 4H and 1H charts). Now I took this trade today with the EUR/JPY and everything...Ignored
I'm new to this thread and I only trade the M5 chart.
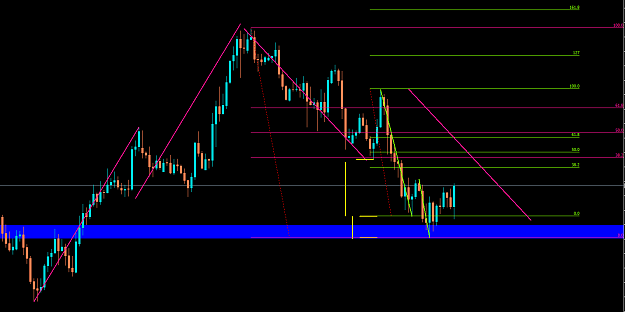
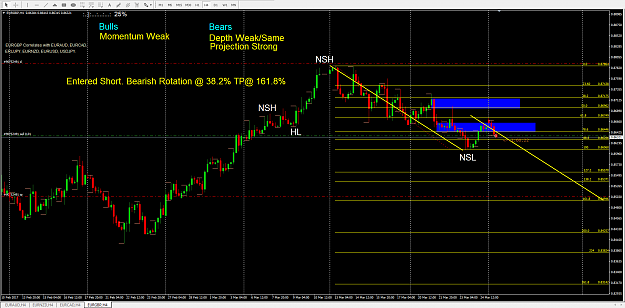
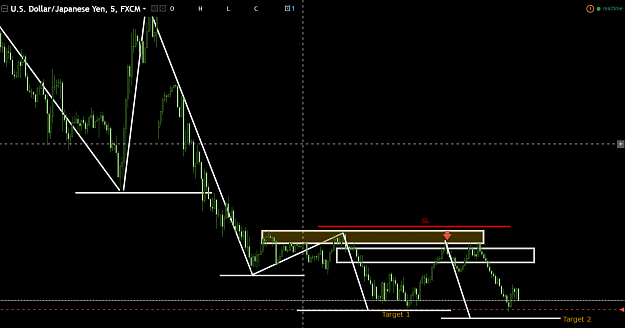
The way I see things on your chart (as I would see them on an M5):
Compared to the last swing down, you have a decrease in the projection (yellow lines) and an increase in the correction depth, with similar momentum.
There is a possible are of structure at the low, and you could argue that price made a 1:1 completion to the downside.
For the previous swing, price didn't make the 38.2 on the correction (green fib).
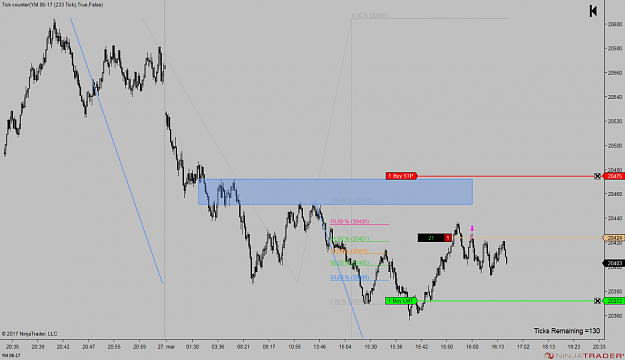
So with all this in mind, I would think that price is due for a deeper correction, possibly up to the 61.8 of the pink fib.
Keep in mind that I only trade the M5, so there may be some differences on the higher time frame.
Also, for some reason, my H4 chart looks a bit different to yours.
Hopefully my chart isn't too confusing.
Cheers,
Finfresh
P.S. I hope I am wrong and the bears come back in before your SL.
Attached Image (click to enlarge)