• Home
  • Forums
  • Trades
  • News
  • Calendar
  • Market
  • Brokers
  • Login
  • Join
  • User/Email: Password:
  • 5:07am
Menu
  • Forums
  • Trades
  • News
  • Calendar
  • Market
  • Brokers
  • Login
  • Join
  • 5:07am
Sister Sites
  • Metals Mine
  • Energy EXCH
  • Crypto Craft

Options

Bookmark Thread

First Page First Unread Last Page Last Post

Print Thread

Similar Threads

Paradox System: post your entry here 11 replies

Paradox system avg monthly ROR for last 12 months 33 replies

Learning the Paradox System=Set up / Trade Plan / Results Only 1 reply

MTS Vs Random Entry - A Paradox 6 replies

lets talk about the system called PARADOX 2 replies

  • Trading Systems
  • /
  • Reply to Thread
  • Subscribe
  • 4,225
Attachments: The Paradox System
Exit Attachments

The Paradox System

  • Last Post
  •  
  • 1 416417Page 418419420 862
  • 1 Page 418 862
  •  
  • Post #8,341
  • Quote
  • Mar 2, 2017 11:11am Mar 2, 2017 11:11am
  •  FourHorseMan
  • | Joined Oct 2006 | Status: member | 13 Posts
Thanks Shinny re-installing was the trick, everything back to normal, I tried for over four hours to fix that, re-installing did it less than 10 min.
 
 
  • Post #8,342
  • Quote
  • Mar 2, 2017 11:38am Mar 2, 2017 11:38am
  •  shinny
  • Joined Sep 2007 | Status: Trading The Matrix | 819 Posts
Quoting FourHorseMan
Disliked
Thanks Shinny re-installing was the trick, everything back to normal, I tried for over four hours to fix that, re-installing did it less than 10 min.
Ignored
No problem, glad you sorted it
Nobody can be told what The Matrix is. You'll have to see it yourself.
 
1
  • Post #8,343
  • Quote
  • Mar 2, 2017 11:59am Mar 2, 2017 11:59am
  •  dove_alliance
  • Joined Jun 2007 | Status: Trading Live For The Last 14 Years. | 5,761 Posts
On thing I have really notice on trading plans is not referencing the trend. As I have said in the past - even consolidation has trends.

When you create your plans the first thing you do is recognize the trend and then create your plan around that trend. In order to create a plan that is objective you also recognize the power of the trend; which element has the power for the trend.

Example:

Both the H1 and H2 Parabolic's has the power going on for 3 days with an uptrend; and everyone wants to trade against that trend. Do I need to say any more?
The Dove - Forex Trainer
 
5
  • Post #8,344
  • Quote
  • Mar 2, 2017 1:02pm Mar 2, 2017 1:02pm
  •  jakdan
  • | Joined Apr 2010 | Status: Trade what u see, not what u think. | 629 Posts
Attached Image
Stop killing our Oceans, Stop using single use plastics.
 
 
  • Post #8,345
  • Quote
  • Mar 2, 2017 1:07pm Mar 2, 2017 1:07pm
  •  InDaMoment
  • | Joined Mar 2016 | Status: Member | 131 Posts
I just upgraded my PC and monitors and need a way to undock charts in MT4 because now I have multiple monitors . I tried IBFX Undock chart but it does't seem to load properly on my system. (It loads but is immediately removed). If someone can advise me would be appreciated.
 
 
  • Post #8,346
  • Quote
  • Mar 2, 2017 1:19pm Mar 2, 2017 1:19pm
  •  shinny
  • Joined Sep 2007 | Status: Trading The Matrix | 819 Posts
Quoting InDaMoment
Disliked
I just upgraded my PC and monitors and need a way to undock charts in MT4 because now I have multiple monitors . I tried IBFX Undock chart but it does't seem to load properly on my system. (It loads but is immediately removed). If someone can advise me would be appreciated.
Ignored
What worked for me in the past is to just spread the terminal across the array then manually fit each chart in each monitor space.
Nobody can be told what The Matrix is. You'll have to see it yourself.
 
 
  • Post #8,347
  • Quote
  • Mar 2, 2017 1:26pm Mar 2, 2017 1:26pm
  •  jakdan
  • | Joined Apr 2010 | Status: Trade what u see, not what u think. | 629 Posts
Quoting InDaMoment
Disliked
I just upgraded my PC and monitors and need a way to undock charts in MT4 because now I have multiple monitors . I tried IBFX Undock chart but it does't seem to load properly on my system. (It loads but is immediately removed). If someone can advise me would be appreciated.
Ignored
IDM

probably better off starting a new post in the Tech part of the forum. someone will probably tell you before the day is out.

good luck

PS you're only supposed to be trading DEMO, how comes you have all this spare cash
Stop killing our Oceans, Stop using single use plastics.
 
 
  • Post #8,348
  • Quote
  • Mar 2, 2017 1:39pm Mar 2, 2017 1:39pm
  •  dove_alliance
  • Joined Jun 2007 | Status: Trading Live For The Last 14 Years. | 5,761 Posts
Quoting InDaMoment
Disliked
I just upgraded my PC and monitors and need a way to undock charts in MT4 because now I have multiple monitors . I tried IBFX Undock chart but it does't seem to load properly on my system. (It loads but is immediately removed). If someone can advise me would be appreciated.
Ignored
OK - First thing is go to "Windows" on the tool bar and click "Tile Windows". Then click "View" and then click "Navigator". Scroll to "Script" and open then scroll to "IBFX - Undock chart" - left click and hold and drag to the chart you want to undock. The chart will undock and drag to the monitor you want that chart on.
The Dove - Forex Trainer
 
 
  • Post #8,349
  • Quote
  • Mar 2, 2017 1:39pm Mar 2, 2017 1:39pm
  •  InDaMoment
  • | Joined Mar 2016 | Status: Member | 131 Posts
Quoting shinny
Disliked
{quote} What worked for me in the past is to just spread the terminal across the array then manually fit each chart in each monitor space.
Ignored
Thanks shinny, your solution worked fine.
 
1
  • Post #8,350
  • Quote
  • Mar 2, 2017 2:14pm Mar 2, 2017 2:14pm
  •  shinny
  • Joined Sep 2007 | Status: Trading The Matrix | 819 Posts
Hello All

That's it for me until Tuesday. I am heading off early in the morning for my Brothers bachelor party. A 4000 mile round trip. Its a long way to go for a beer!!

Regards
Shaun
Nobody can be told what The Matrix is. You'll have to see it yourself.
 
2
  • Post #8,351
  • Quote
  • Mar 2, 2017 2:32pm Mar 2, 2017 2:32pm
  •  InDaMoment
  • | Joined Mar 2016 | Status: Member | 131 Posts
Quoting dove_alliance
Disliked
{quote} OK - First thing is go to "Windows" on the tool bar and click "Tile Windows". Then click "View" and then click "Navigator". Scroll to "Script" and open then scroll to "IBFX - Undock chart" - left click and hold and drag to the chart you want to undock. The chart will undock and drag to the monitor you want that chart on.
Ignored
Thanks Dove, I did as you explained and that worked good. Thanks
 
 
  • Post #8,352
  • Quote
  • Mar 2, 2017 2:45pm Mar 2, 2017 2:45pm
  •  dudko777
  • | Joined Dec 2016 | Status: Member | 60 Posts
Quoting shinny
Disliked
Hello All That's it for me until Tuesday. I am heading off early in the morning for my Brothers bachelor party. A 4000 mile round trip. Its a long way to go for a beer!! Regards Shaun
Ignored
Thank you. Have a good time!
Dreamer
 
 
  • Post #8,353
  • Quote
  • Mar 2, 2017 3:34pm Mar 2, 2017 3:34pm
  •  jakdan
  • | Joined Apr 2010 | Status: Trade what u see, not what u think. | 629 Posts
Quoting shinny
Disliked
Hello All That's it for me until Tuesday. I am heading off early in the morning for my Brothers bachelor party. A 4000 mile round trip. Its a long way to go for a beer!! Regards Shaun
Ignored
it will be worth it

thanks again and enjoy
Stop killing our Oceans, Stop using single use plastics.
 
 
  • Post #8,354
  • Quote
  • Mar 2, 2017 4:59pm Mar 2, 2017 4:59pm
  •  Therapsid
  • | Joined Mar 2016 | Status: Member | 176 Posts
Quoting shinny
Disliked
Hello All That's it for me until Tuesday. I am heading off early in the morning for my Brothers bachelor party. A 4000 mile round trip. Its a long way to go for a beer!! Regards Shaun
Ignored
My brother is a 6000 mile round trip ...haven't done that in much too long.
 
 
  • Post #8,355
  • Quote
  • Mar 2, 2017 5:08pm Mar 2, 2017 5:08pm
  •  InDaMoment
  • | Joined Mar 2016 | Status: Member | 131 Posts
Quoting jakdan
Disliked
{quote} IDM probably better off starting a new post in the Tech part of the forum. someone will probably tell you before the day is out. good luck PS you're only supposed to be trading DEMO, how comes you have all this spare cash
Ignored
Good one, haha
 
 
  • Post #8,356
  • Quote
  • Mar 2, 2017 5:22pm Mar 2, 2017 5:22pm
  •  Explorateur
  • | Joined Oct 2011 | Status: Member | 18 Posts
dove_alliance, many thanks! Great work!
 
 
  • Post #8,357
  • Quote
  • Mar 2, 2017 6:21pm Mar 2, 2017 6:21pm
  •  Lyall
  • | Joined Mar 2010 | Status: Member | 66 Posts
Quoting Therapsid
Disliked
{quote} My brother is a 6000 mile round trip ...haven't done that in much too long.
Ignored
You can't even drive that far in New Zealand. You'd be driving around and around!!
 
1
  • Post #8,358
  • Quote
  • Edited at 1:47am Mar 3, 2017 1:29am | Edited at 1:47am
  •  jakdan
  • | Joined Apr 2010 | Status: Trade what u see, not what u think. | 629 Posts
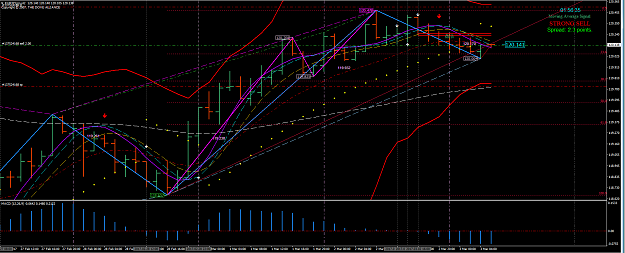
DAILY CHART - DATE: 03/03/17 6.00 GMT

News Release
US Non manufacturing PMI 3.00pm
FOMC Members speak 3-5 pm
Yellen speaks 6.00 pm

ROMAR: Resistance

EMA: Resistance

Parabolic: Support

NOTES: now in Consolidation with the 4 fourhorsemen turning up acting as support with Romar playing its part as resistance
DB attached at the swing low 118.225
Blue dash and Gold divergence also attached to this point
SAR attached at swing high 120.478
market back into balance (but needs to fall to get to purple)
MACD above 0


2 HOUR CHART:

Opening: 120.179 120.093

ROMAR: Support

EMA: resistance

Parabolic: resistance

NOTES: The two hour has the 4 horsemen turning down all acting as resistance
MACD below 0
magenta tag and gold divergence @ 120.485 also 0 fib red
DB swing down @ 120.012 SAR tag together with light blue dash.
Last red arrow


1 HOUR CHART:

ROMAR: Support

EMA: resistance

Parabolic: resistance

Notes: The 1 hour has all 4 horsemen heading slightly down hill through the middle of the market.
Magenta tag @ 120.478 (DB is removed) on red 0 Fibo

Entry: looking for short on a pull back to EMA (Trigger pulled on 6.00 am candle)

Looking for Long when EMA, white and smooth cross purple and get back into the Romar trend

Attached Image (click to enlarge)
Click to Enlarge

Name: ej 0303.PNG
Size: 83 KB
Stop killing our Oceans, Stop using single use plastics.
 
 
  • Post #8,359
  • Quote
  • Edited at 5:23am Mar 3, 2017 4:44am | Edited at 5:23am
  •  marian
  • | Joined Nov 2010 | Status: Member | 196 Posts
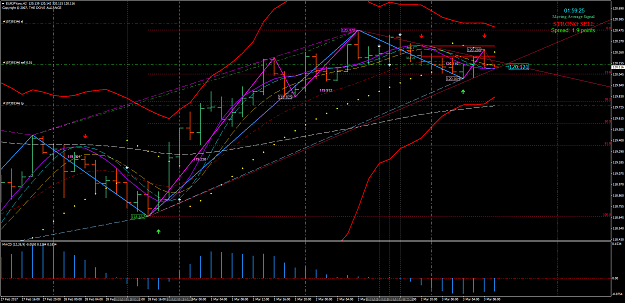
Date: 3/3/2017, 04:30 ET

Daily:
ROMAR: Resistance
EMA: Resistance
PSAR: Support

Check List:
Last MACD 0 crossing: Up
Last EMA Alert Arrow: Up
Last DB Attachment: 118.225, bottom
Last SAR Attachment: 120.478, top
Fibo: Up

Notes: Purple, White and Smooth are support. The Parabolic has been eliminated with the White crossing Purple. Parabolic flip not locked in, maybe with the next candle. Market less than 30 pips below the ROMAR resistance.

2 HR:
ROMAR: Support
EMA: Resistance
PSAR: Resistance

Check List:
Last MACD 0 crossing: Down
Last EMA Alert Arrow: Up
Last DB Attachment: 120.004, bottom
Last SAR Attachment: 120.288, top
Fibo: Down

Notes: 4 horsemen in downtrend, White and Smooth sliding above Purple, Parabolic is resistance, EMA sliding slightly under Smooth. Divergences attached at the Fibo 0 level. SAR attachment on the other side of Purple at the Parabolic with the lower high at 120.288.

1 HR:
ROMAR: Support
EMA: Resistance
PSAR: Support

Check List:
Last MACD 0 crossing: Up
Last EMA Alert Arrow: Up
Fibo up or down: Down

Notes: White and Smooth crossing Purple for the up. EMA at Purple. The Parabolic has been eliminated with the White crossing Purple. Parabolic flip not locked in, maybe with the next candle. MACD crossing the 0 upwards.

Final Notes: Market in consolidation with ROMAR being support on H1 and H2 but resistance on Daily. On H2, there is an underlying downtrend with the Fibo red and down, divergence attachments at Fibo 0 level. After a retrace down, the SAR is attached with the Parabolic downtrend at a lower high on the other side of Purple. Looks like ranging but with EMA/Purple breakout and the 4 horsemen in downtrend. On the Daily market just below ROMAR resistance.

Entry: Entered short with the 05:00 ET open candle, 40/40, SL above Fibo 0 level, TP at ROMAR. Let's see what happens.
Attached Image (click to enlarge)
Click to Enlarge

Name: EURJPYproH2.png
Size: 92 KB
 
1
  • Post #8,360
  • Quote
  • Mar 3, 2017 5:09am Mar 3, 2017 5:09am
  •  Retrogue
  • Joined Feb 2017 | Status: Member | 229 Posts
Upcoming news? 3pm GMT
Closed MT4 after 17:00 EST? – Yes

Date: Plan created 22:00 02/03/2017 for 03/03/2017

Daily:
ROMAR - Resistance
EMA - Resistance
PSAR - Resistance (eliminated)
Check List:
Last MACD 0 crossing - up
Last EMA Alert Arrow - down
Last DB Attachment – Low at 118.225
Fibo up
Notes: Smooth purple cross with daily candle testing romar resistance a long way from purple. Daily in consolidation.

2 HR:
ROMAR - Support
EMA - Support
PSAR – Support (eliminated)
Check List:
Last MACD 0 crossing - down
Last EMA Alert Arrow - down
Last DB Attachment – Top 120.478
Fibo down
Notes: Divergence attached at 0 fib with DB and Sar confirming end of uptrend. Purple White cross. Smooth now at purple. Candle has broken through EMA support.

1 HR:
ROMAR - Support
EMA - Resistance
PSAR - Resistance
Check List:
Last MACD 0 crossing - down
Last EMA Alert Arrow - down
Last DB Attachment – N/A
Fibo down
Notes: Parabolic has flipped with white smooth crossing purple. 4 horsemen are lined up for a downtrend. 4 horsemen are now resistance.

Final Notes for all three charts: Consolidation. Trades can be long from support and short at resistance. Daily candle testing Romar at 120.478 a long way from purple. Divergence on H2 indicating end of H1 and H2 uptrend.

Entry:
Short: Wait for 2 hr white smooth purple cross and parabolic flip to confirm entry. Check for 40 pip to target - 2 hr support Romar.

Notes for readjustments:
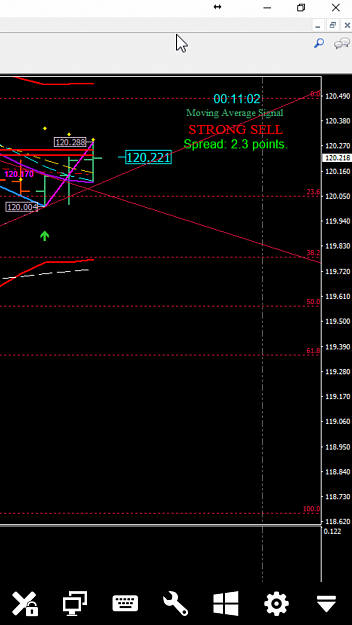
Missed entry at 6am gmt with opening at white. Took short entry with hit on parabolic. Trying to deploy patience with my entries as Doves advise. Screenshot of H2 on my phone as at work.
Attached Image (click to enlarge)
Click to Enlarge

Name: Screenshot_20170303-094853.png
Size: 232 KB
Never Give Up
 
1
  • Trading Systems
  • /
  • The Paradox System
  • Reply to Thread
    • 1 416417Page 418419420 862
    • 1 Page 418 862
13 traders viewing now, 5 are members:
Invisible
,
Invisible
,
gynexx
,
roby76
,
maas
  • More
Top of Page
  • Facebook
  • Twitter
About FF
  • Mission
  • Products
  • User Guide
  • Media Kit
  • Blog
  • Contact
FF Products
  • Forums
  • Trades
  • Calendar
  • News
  • Market
  • Brokers
  • Trade Explorer
FF Website
  • Homepage
  • Search
  • Members
  • Report a Bug
Follow FF
  • Facebook
  • Twitter

FF Sister Sites:

  • Metals Mine
  • Energy EXCH
  • Crypto Craft

Forex Factory® is a brand of Fair Economy, Inc.

Terms of Service / ©2022