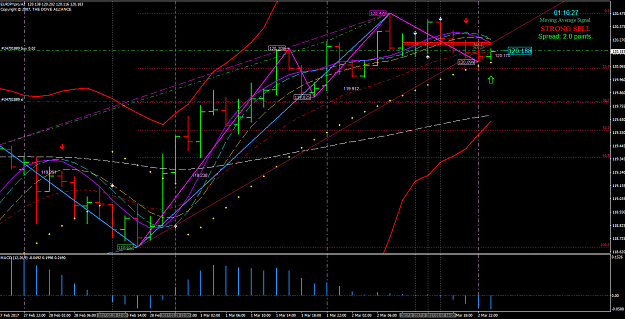
• Home
  • Forums
  • Trades
  • News
  • Calendar
  • Market
  • Brokers
  • Login
  • Join
  • User/Email: Password:
  • 12:24pm
Menu
  • Forums
  • Trades
  • News
  • Calendar
  • Market
  • Brokers
  • Login
  • Join
  • 12:24pm
Sister Sites
  • Metals Mine
  • Energy EXCH
  • Crypto Craft

Options

Bookmark Thread

First Page First Unread Last Page Last Post

Print Thread

Similar Threads

Paradox System: post your entry here 11 replies

Paradox system avg monthly ROR for last 12 months 33 replies

Learning the Paradox System=Set up / Trade Plan / Results Only 1 reply

MTS Vs Random Entry - A Paradox 6 replies

lets talk about the system called PARADOX 2 replies

  • Trading Systems
  • /
  • Reply to Thread
  • Subscribe
  • 4,218
Attachments: The Paradox System
Exit Attachments

The Paradox System

  • Last Post
  •  
  • 1 418419Page 420421422 861
  • 1 Page 420 861
  •  
  • Post #8,381
  • Quote
  • Mar 3, 2017 12:20pm Mar 3, 2017 12:20pm
  •  marian
  • | Joined Nov 2010 | Status: Member | 196 Posts
Quoting dove_alliance
Disliked
Alright Traders - to start with you have the H1 and H2 ROMAR in an uptrend consolidation with the Daily downtrend ROMAR. You also had the H2 SAR/DB attached on the previous candle in CONSOLIDATION with the H2 uptrend ROMAR PLUS - Divergence. THE BIG PICTURE - back into the H2 ROMAR trend with confluence. Bottom line is seeing the the whole picture on your trading plan before pulling the trigger.
Ignored
Thank you Dove, very much appreciated.

So the DB/SAR attachment at the bottom in consolidation with ROMAR uptrend plus Divergence attachment means: Back into the ROMAR trend.
 
 
  • Post #8,382
  • Quote
  • Mar 3, 2017 12:25pm Mar 3, 2017 12:25pm
  •  Retrogue
  • Joined Feb 2017 | Status: Member | 229 Posts
Quoting dove_alliance
Disliked
Alright Traders - to start with you have the H1 and H2 ROMAR in an uptrend consolidation with the Daily downtrend ROMAR. You also had the H2 SAR/DB attached on the previous candle in CONSOLIDATION with the H2 uptrend ROMAR PLUS - Divergence. THE BIG PICTURE - back into the H2 ROMAR trend with confluence. Bottom line is seeing the the whole picture on your trading plan before pulling the trigger.
Ignored
I'm kicking myself right now - When you explain it all becomes so clear.

Thank you Dove for the explanation and patience to take time to reply.
Never Give Up
 
 
  • Post #8,383
  • Quote
  • Mar 3, 2017 12:30pm Mar 3, 2017 12:30pm
  •  jakdan
  • | Joined Apr 2010 | Status: Trade what u see, not what u think. | 629 Posts
thanks Dove

although I got in earlier than the other guys would it have been prudent to pull my trade realising the DB/SAR attachment then the green arrow it was going to turn?

still learning and thanks for your time.

PS. only for future reference however hope not to make the same mistake again
Stop killing our Oceans, Stop using single use plastics.
 
 
  • Post #8,384
  • Quote
  • Mar 3, 2017 12:58pm Mar 3, 2017 12:58pm
  •  dove_alliance
  • Joined Jun 2007 | Status: Trading Live For The Last 14 Years. | 5,761 Posts
Quoting jakdan
Disliked
thanks Dove although I got in earlier than the other guys would it have been prudent to pull my trade realising the DB/SAR attachment then the green arrow it was going to turn? still learning and thanks for your time. PS. only for future reference however hope not to make the same mistake again
Ignored
You was waiting for the pull back to EMA which means the DB/SAR was already attached with Divergence. You had the H2 in an uptrend consolidation with the Daily when you pulled the trigger at EMA. This also means you did not see the whole picture with the swing showing going back into the H2 ROMAR uptrend with confluence of the DB/SAR and Divergence. You have to really study to deviate the separation between trend and consolidation. This way you would be able to see the whole picture.
The Dove - Forex Trainer
 
3
  • Post #8,385
  • Quote
  • Mar 3, 2017 1:06pm Mar 3, 2017 1:06pm
  •  jakdan
  • | Joined Apr 2010 | Status: Trade what u see, not what u think. | 629 Posts
Quoting dove_alliance
Disliked
{quote} You was waiting for the pull back to EMA which means the DB/SAR was already attached with Divergence. You had the H2 in an uptrend consolidation with the Daily when you pulled the trigger at EMA. This also means you did not see the whole picture with the swing showing going back into the H2 ROMAR uptrend with confluence of the DB/SAR and Divergence. You have to really study to deviate the separation between trend and consolidation. This way you would be able to see the whole picture.
Ignored
Thank you

just looked at snapshot------ penny dropped
Stop killing our Oceans, Stop using single use plastics.
 
 
  • Post #8,386
  • Quote
  • Mar 3, 2017 6:36pm Mar 3, 2017 6:36pm
  •  Hendo
  • Joined Jan 2017 | Status: Member | 122 Posts
Hey Guys,

Haven't posted in a while been very busy balancing family, work, and trading. Thought this would be a good time to post last nights trade plan, entry, and evaluation.


Session Sydney: EUR/JPY 3/2/2017

Daily Open: At 38.2 FIBO way above EMA.
ROMAR: Resistance
EMA: Resistance
Parabolic: Support
Notes: Purple crossed White and Smooth up, open above EMA. SAR attach with price tag above ROMAR. Trend EMA arrow up. MACD zero cross arrow up. FIBO up.

H1
Romar: Support
EMA: Resistance
Parabolic: Resistance
Notes: Four Horsemen down. MACD zero cross arrow down. Trend EMA arrow down. MA cross over arrow down. FIBO down.

H2
ROMAR: Support
EMA: Support
Parabolic: Support
Notes: Purple crossed White and Smooth down. DB up with SAR attach as well as GREEN and MAGENTA DIVERGENCE with magenta price tag at 0.0 FIBO.SAR attach just above PSAR.

FINAL NOTES: H2 up. Daily Purple crossed White and Smooth up, opened way above EMA, with PSAR flip for the up. All indications of trend continuing up. Will enter long position off H2 support.

Adjustments:

Buy: Entered long position at H2 EMA. Set TP +40 SL 40.


Result: Took + 40 pips from the market

Evaluation: I Felt good pulling the trigger on this trade only because of my faith in the Paradox. I feel when I become more patient, my entries will be dead on, and they have not been that bad for some time now. That’s the only thing I’m lacking right now in my trading, and what I lack in patience the Paradox makes up for by doing what Dana says it will do, as well as what the indicators say to me as I’m composing my trade plans. My main motivation for pulling the trigger when I did was, the distance the H2 EMA was from ROMAR, as well as ROMAR being support. Also, Purple crossing White and Smooth with the PSAR flip on the new DAILY opening candle at the 38.2 FIBO going up. All in all a good trade.

Side Note: As Dana has mentioned before, when I make my plan by the time I get to final notes I know if I will be entering a Long or Short position. I never have the option for both. I’m either going Long off support, or going Short off resistance. Based on what the indicators are saying to me after I read it back to myself. The only thing to think about after that is determining which level of support or resistance to keep it simple.
Attached Image (click to enlarge)
Click to Enlarge

Name: Screenshot1.png
Size: 503 KB
 
4
  • Post #8,387
  • Quote
  • Edited Mar 4, 2017 12:37am Mar 3, 2017 10:02pm | Edited Mar 4, 2017 12:37am
  •  OliveBranch
  • Joined Feb 2017 | Status: Member | 382 Posts
[quote=Hendo;9625575]Hey Guys, Haven't posted in a while been very busy balancing family, work, and trading. Thought this would be a good time to post last nights trade plan, entry, and evaluation. Session Sydney: EUR/JPY 3/2/2017 Daily Open: At 38.2 FIBO way above EMA. ROMAR: Resistance EMA: Resistance Parabolic: Support Notes: Purple crossed White and Smooth up, open above EMA. SAR attach with price tag above ROMAR. Trend EMA arrow up. MACD zero cross arrow up. FIBO up. H1 Romar: Support EMA: Resistance Parabolic: Resistance Notes: Four Horsemen down. MACD zero cross arrow down. Trend EMA arrow down. MA cross over arrow down. FIBO down. H2 ROMAR: Support EMA: Support Parabolic: Support Notes: Purple crossed White and Smooth down. DB up with SAR attach as well as GREEN and MAGENTA DIVERGENCE with magenta price tag at 0.0 FIBO.SAR attach just above PSAR. FINAL NOTES: H2 up. Daily Purple crossed White and Smooth up, opened way above EMA, with PSAR flip for the up. All indications of trend continuing up. Will enter long position off H2 support. Adjustments: Buy: Entered long position at H2 EMA. Set TP +40 SL 40. Result: Took + 40 pips from the market Evaluation: I Felt good pulling the trigger on this trade only because of my faith in the Paradox. I feel when I become more patient, my entries will be dead on, and they have not been that bad for some time now. Thats the only thing Im lacking right now in my trading, and what I lack in patience the Paradox makes up for by doing what Dana says it will do, as well as what the indicators say to me as Im composing my trade plans....

Hello Hendo,
Well done. May I ask how you put that green arrow onto your screen shot? This makes identification of time of your action very easy to see.

I too went long, however not at the same time as you did. Much later in fact. Due to my computer currently being in for maintenance i am unable to screen shot nor able to show my plan. Apologies.
Having said that, i am wondering the following in relation to Doves posting to us all regarding Balance. Balance of Paradox & Balance of Self as a trader. I am reviewing Hendo's entry point compared to my own entry and I'm suspicious that I have been enacting my trading from a bias that is coming from a plane or level of evaluation of "force" within the market. This thought that may be coming from my personal bias and past experiences, may be adversely affecting my trading plans and delaying me from better entry points due to being blinded from the truth that the Paradox always shows. My perception of the possible bias that i come from or focus on is force. eg: balancing a weight on a scale has gravity as a downward force upon the scale.... & how can we use this gravitational force to our benefit?.... by observing the effects of gravity upon the weight such as on a semi trailer rolling down a hill.... It is easy to see the semi needs much less force applied to it to get moving down when compared to pushing the semi up the hill which needs some quite hefty force to overcome the gravity upon the Semi.
Now if i may get to my point....In my plan yesterday I waited until the 2hr candle closed above the Daily ROMAR - thus switching from the Daily ROMAR being resistance to that of being Support, the 2hr also showed the uptrend, therefore the daily balance is rebalancing at a different fulcrum allowing an entry for a long......and no longer holding the 2hr into submission from the previous resistance that the daily was exerting upon the 2hr.... thus all the stars in the zodiac constellation aligned for me to feel confident enough to pull the trigger for the long - BUT only after the daily showed ROMAR as being support. This was my perception yesterday anyway...
Today, after reviewing other traders plans & i begin to wonder if...
As per Dove's advice in post 3976 - What is wrong with everyone. What is the Paradox about ---- it is about support and resistance and apparently most of you are missing the boat; going off into the twilight zone and seeing things that are not even there.
Has my fear from potentially being slapped down by Big Fat Momma Daily ROMAR overshadowed exceedingly good entry or multiple entries & hours and hours of wasted hours of candle watching every 120 mins before the Daily ROMAR crossing yesterday? & in this instance, was i just lucky to get the TP40? I saw Dove's hint and had much faith in their advice; but did not want to pull the trigger as I wanted to actually be able to "see it" for myself and not just hold Dove's very kind hand. I aim to be inter-dependent, and then independent - not always dependent. Maybe i need to learn to develop a more Tai Chi balanced approach to my trading - not too much, not too little... just enough is going to be enough, kind of approach. Am i wanting to use too many indicators to support my plan of when i should enter a trade and pull the trigger. Anyone have any thoughts to this concept & my quandary & would like to share with the thread? Perhaps many people will learn something extra...i hope i'm not taking up too much valuable thread space with such silly Q's and visualisations.
And some visual humour related to the subject to "lighten" the mood....

Oli
Attached Image
If you make up your own rules then the story is sad.....
 
 
  • Post #8,388
  • Quote
  • Edited at 6:55am Mar 4, 2017 4:35am | Edited at 6:55am
  •  marian
  • | Joined Nov 2010 | Status: Member | 196 Posts
Quoting Hendo
Disliked
Hey Guys, Haven't posted in a while been very busy balancing family, work, and trading. Thought this would be a good time to post last nights trade plan, entry, and evaluation. Session Sydney: EUR/JPY 3/2/2017 Daily Open: At 38.2 FIBO way above EMA. ROMAR: Resistance EMA: Resistance Parabolic: Support Notes: Purple crossed White and Smooth up, open above EMA. SAR attach with price tag above ROMAR. Trend EMA arrow up. MACD zero cross arrow up. FIBO up. H1 Romar: Support EMA: Resistance Parabolic: Resistance Notes: Four Horsemen down. MACD zero cross...
Ignored
Hello Hendo,

Thanks a lot for sharing your trading plans and entries!!

My question would be, how did you know in this moment that the PSAR on the 2 hour would hold support and that the market would not break it?

My understanding is this: When any objective is not the same on the 2 hour as on the Daily (such as ROMAR on the 2 hour opposite of the Daily), then this is consolidation. So the 2 hour was (and still is) in an uptrend consolidation with the Daily. And when White crosses Purple in consolidation, this eliminates the PSAR as S/R. So it can either bounce off of the PSAR or break it; the trader does not know what will happen until it happens. And in this moment of your entry you had only the SAR attached on the previous candle, without Divergence. So I'm just wondering, how did you know the PSAR will hold support? I would understand it, if all three S/R on the Daily would be in compliance for a strong uptrend, but as a matter of fact, ROMAR and EMA are holding resistance.

Thanks again for posting your plans.
 
1
  • Post #8,389
  • Quote
  • Mar 4, 2017 8:43am Mar 4, 2017 8:43am
  •  marian
  • | Joined Nov 2010 | Status: Member | 196 Posts
Quoting OliveBranch
Disliked
May I ask how you put that green arrow onto your screen shot? This makes identification of time of your action very easy to see.
Ignored
Hello Oli,

Let me quickly answer this question. Simply put this 'Arrow Up' on your chart:
Attached Image
Double-click on it, then right-click and click on 'Arrow properties...':
Attached Image
Then you can change color and size of the arrow:
Attached Image
 
2
  • Post #8,390
  • Quote
  • Mar 4, 2017 9:24am Mar 4, 2017 9:24am
  •  jakdan
  • | Joined Apr 2010 | Status: Trade what u see, not what u think. | 629 Posts
Traders
well that is another Saturday reading and learning another 100 pages ( not just once either ) only 100 to go.
also realised my trading plan is light so will change for next week.
read some pages over and over and still not 100% but will get there.

one thing I would appreciate is if someone could post or Pm an idiots guide to changing the alerts to a tune, never took much notice of them as yet and believe this will help me out reading the last 100 pages.

cheers ant
Stop killing our Oceans, Stop using single use plastics.
 
 
  • Post #8,391
  • Quote
  • Mar 4, 2017 9:32am Mar 4, 2017 9:32am
  •  marian
  • | Joined Nov 2010 | Status: Member | 196 Posts
Quoting jakdan
Disliked
Traders well that is another Saturday reading and learning another 100 pages ( not just once either ) only 100 to go. also realised my trading plan is light so will change for next week. read some pages over and over and still not 100% but will get there. one thing I would appreciate is if someone could post or Pm an idiots guide to changing the alerts to a tune, never took much notice of them as yet and believe this will help me out reading the last 100 pages. cheers ant
Ignored
Go to the 'Tools' > 'Options' dialog in MT4 and go to the 'Events' tab. You will see a field called 'Alert' and the file name associated with it (probably alert.wav). Double-click on the file name, then click the down arrow and select any sound file on the list. You can add to the list by putting any valid sound file in the MT4 sounds folder. If you click on 'Choose other...', the sounds folder will open and you can put in your own tune.
 
1
  • Post #8,392
  • Quote
  • Mar 4, 2017 10:59am Mar 4, 2017 10:59am
  •  dove_alliance
  • Joined Jun 2007 | Status: Trading Live For The Last 14 Years. | 5,761 Posts
Quoting marian
Disliked
{quote}Hello Hendo, Thanks a lot for sharing your trading plans and entries!! My question would be, how did you know in this moment that the PSAR on the 2 hour would hold support and that the market would not break it? My understanding is this: When any objective is not the same on the 2 hour as on the Daily (such as ROMAR on the 2 hour opposite of the Daily), then this is consolidation. So the 2 hour was (and still is) in an uptrend consolidation with the Daily. And when White crosses Purple in consolidation, this eliminates the PSAR as S/R. So...
Ignored
Marian - Hendo is one of the 5% and comes on everyone once in awhile to post a trade as he busy with other things. So I will answer for him:

take a close look at his entry in the moment and you will see why he took the trade. The Divergence he was talking about was on top at the "0" Fibo with the SAR detaching from the DB and attaching at the Parabolic. The question you should be asking is the rule for this scenario; and his notes on the H2 had answered that question.
The Dove - Forex Trainer
 
1
  • Post #8,393
  • Quote
  • Mar 4, 2017 11:36am Mar 4, 2017 11:36am
  •  marian
  • | Joined Nov 2010 | Status: Member | 196 Posts
Quoting dove_alliance
Disliked
{quote} Marian - Hendo is one of the 5% and comes on everyone once in awhile to post a trade as he busy with other things. So I will answer for him: take a close look at his entry in the moment and you will see why he took the trade. The Divergence he was talking about was on top at the "0" Fibo with the SAR detaching from the DB and attaching at the Parabolic. The question you should be asking is the rule for this scenario; and his notes on the H2 had answered that question.
Ignored
Well, I think I begin to understand why it is a process between 6 and 12 months of practice and study. The thing with "DB/SAR attachment with Divergence in consolidation": I had read that a while ago and copied it to my notes, but I did not recognize it on Friday. What a great opportunity to learn from the 5%.
 
 
  • Post #8,394
  • Quote
  • Edited at 3:45pm Mar 4, 2017 3:21pm | Edited at 3:45pm
  •  dove_alliance
  • Joined Jun 2007 | Status: Trading Live For The Last 14 Years. | 5,761 Posts
What is Confluence?

Confluence: a situation in which two things come together or happen at the same time.

Essentially confluence represents two or more things coming together at the same time. In terms of trading, we can say that confluence is when two or more factors come together at the same place on a chart or two different charts.

Examples of these things might be a key support or resistance level, Divergence with buy or sell signal, or even something as simple as a strong trend on two charts. All of these things form what well call Confluence Factors. In other words a strong trend might be one factor; Divergence might be a second factor and so on.

Putting the Odds in Your Favor.

I think I can be so bold as to say that consistent profits are the goal of every serious trader. So why then do only a small portion of traders make it to this level? It all comes down to the use of confluence. Those traders who can be called consistently profitable have found a way to identify and harness the power of confluence in a way that puts the odds in their favor.

The ability to put the odds in your favor is what trading is all about. Figure out a way to do this over and over again and you'll be well on your way to becoming profitable. This is where the combination of various Confluence Factors comes into play. In other words; the more Confluence Factors present on any given setup, the greater the odds are that the setup will move in the intended direction.

Putting the Power of Confluence to Work.

We all know that trading with the trend, or path of least resistance, is always a good idea. At the risk of sounding cliche, the old saying, "the trend is your friend" is absolutely true in my experience. Even in consolidation placing the Confluence Factor into place is very profitable.

The major problem is in creating your trading plan. When creating a trading plan you must be alert mentally with confluence in all three charts. Most times confluence is showing as you go through the scenarios on your plans. As you place together your final notes you will see confluence ; either already there or constructing a confluence.

One thing you have to always keep in mind and that is how support/resistance is constructed from one chart to the other. Such as ROMAR: H1 will fist show the change of the ROMAR trend in crossing EMA. Next is the H2 will follow suit. Once the H2 ROMAR is in the trend then the Daily ROMAR will be hit. Then a process of days for the Daily to break ROMAR or Hold its footing as Support/Resistance. That in itself is confluence.

The same with the 4 Horsemen on the H1 in consolidation once the Horsemen are in place on the H1 then H2 is next. Once the Parabolic had flipped on the H1 then be looking for the H2 Parabolic confluence. The only problem is recognizing sliders which is very easy.

Once the H1 Horsemen are in trend with the Parabolic flip, then show patience with the H2. If the H2 EMA DOES NOT CROSS Purple on the next candle of the SMOOTH crossing then be looking for a slider and/or a shallow swing of 20 - 60 pips. If you get both, or either, the DB/SAR on the slider then entry is made with confluence.

This is only a couple of examples as the confluence variables are endless within the Paradox; in both trend and consolidation. All you need to do is gain patience and learn. With this virtue of patience you will be able to tap into the power of the Paradox and gain a very substantial amount of wealth.

Most traders have too much baggage from previous past and was never taught the power of confluence. They were taught price action, drawing trend lines, believing in news releases, etc, etc, etc. But never taught how to tap into confluence with proper indicators. And if you need too; then start over in learning how to create a trading plan looking for confluences. By tapping into confluence you will be surprise how easy it is to read trends and consolidated trends. Bottom line - confluence will guide you into the right trade. All you need to do is study the charts in how confluence works.

CONFLUENCE - two or more "things" coming together at the same time (point) either on one chart or multiple charts.

THINGS - support, resistance, and divergence.
The Dove - Forex Trainer
 
6
  • Post #8,395
  • Quote
  • Mar 4, 2017 4:20pm Mar 4, 2017 4:20pm
  •  dove_alliance
  • Joined Jun 2007 | Status: Trading Live For The Last 14 Years. | 5,761 Posts
One mistake traders make is getting in too early or too late. Too early is not a major problem provide your entry is within the range of entry. This way you have the 40 SL protecting you. But getting in too late is a major problem. If you miss your entry and then you wait another 60 or 80 pips before pulling the trigger - you are almost guaranteed of your SL being hit. You have to ALWAYS remember the 80% rule of the market is in consolidation. A trend will not last forever in this market. If your entry goes more than 20 pips from entry then let it go and wait another day. You always wait for the market showing a new trend or swing and place your entry at the beginning. Hesitation is your worst enemy in which most of you are finding out. Another mistake is trading against your trading plan and placing both short and long on your plan. Your plan should always be constructed on either long or short; not both. If you cannot see the trend on your plan; then step down and let it go for another day - and take time in learning how to see the trend. The market is one way or the other - not both ways. Your final notes should always be for the long or the short. Never both ways and the reason is you are not focus going both ways.
The Dove - Forex Trainer
 
8
  • Post #8,396
  • Quote
  • Mar 4, 2017 8:38pm Mar 4, 2017 8:38pm
  •  OliveBranch
  • Joined Feb 2017 | Status: Member | 382 Posts
Thank you Dove.
Understood.
Attached Images
If you make up your own rules then the story is sad.....
 
 
  • Post #8,397
  • Quote
  • Edited at 5:49am Mar 6, 2017 5:38am | Edited at 5:49am
  •  Retrogue
  • Joined Feb 2017 | Status: Member | 229 Posts
Upcoming news? 3pm GMT

Closed MT4 after 17:00 EST? - Yes

Market in balance? - No

Date: 05/03/2017 22:00 Sydney session

Daily:
ROMAR - Resistance
EMA - Support
PSAR - Support

Check List:
Last MACD 0 crossing -up
Last EMA Alert Arrow - down
Last DB Attachment up 121.160
Fibo up

Notes: White and smooth crossed purple and now ema has followed in becoming support with romar resistance. The daily is in consolidation. Second Parabolic locking in uptrend. DB attached with magenta divergence on the other side of purple with a thistle price box. Candle opened at 50 fib.

2 HR:
OPEN PRICE 120.771
ROMAR - Support
EMA - Support
PSAR - Support

Check List:
Last MACD 0 crossing - up
Last EMA Alert Arrow - up
Last DB Attachment 121.160
Fibo down

Notes: Four horsemen in uptrend . DB attached with magenta divergence and magenta price box. Candle opened at smooth support.

1 HR:
ROMAR - Support
EMA - Support
PSAR - Support

Check List:
Last MACD 0 crossing - up
Last EMA Alert Arrow - down
Last DB Attachment N/A
Fibo down

Notes: H1 in consolidation white and purple cross. Candle opened below EMA support.

Final Notes for all three charts: Consolidated uptrend. H1 and H2 in uptrend. 22:00 candle opened at H2 smooth with confluence of daily 50 fib. Daily is not in balance, candle cp is 95 pips from purple.

Entry:
Long: Wait for market to get in balance with touch on daily purple and look for opportunity to go long


Notes for readjustments:

My entry: Daily candle touched purple, H2 divergence attached with DB at H2 50 fib which is also H1 Romar support and daily purple and romar very close to cross. H2 smooth crossed purple but EMA didn't cross on the next candle indicating a shallow crossing back into the Romar uptrend.
TP 40 and SL 40
Edit : Had to enter mid candle, as due to being at work I will be in a meeting and unable to enter later on new candle.
Attached Image (click to enlarge)
Click to Enlarge

Name: Screenshot_20170306-101719.png
Size: 247 KB
Never Give Up
 
 
  • Post #8,398
  • Quote
  • Mar 6, 2017 6:01am Mar 6, 2017 6:01am
  •  Cili
  • | Joined Apr 2016 | Status: Member | 63 Posts
Quoting Retrogue
Disliked
Upcoming news? 3pm GMT Closed MT4 after 17:00 EST? - Yes Market in balance? - No Date: 05/03/2017 22:00 Sydney session Daily: ROMAR - Resistance EMA - Support PSAR - Support Check List: Last MACD 0 crossing -up Last EMA Alert Arrow - down Last DB Attachment up 121.160 Fibo up Notes: White and smooth crossed purple and now ema has followed in becoming support with romar resistance. The daily is in consolidation. Second Parabolic locking in uptrend. DB attached with magenta divergence on the other side of purple with a thistle price box. Candle opened...
Ignored
Hi Retrogue,

I think there are some mistakes in your trading plan:
- EMA is not Support, it is resistance in H1 and H2
- Parabolic is also resistance in H1 and H2
- PSAR is resistance in H1 and H2
- MACD crossing is down in H1 and H2
- DB attachment in H2 is 120.340
- EMA arrow in H2 is down

With this Setup you get a complete different Picture.
 
 
  • Post #8,399
  • Quote
  • Mar 6, 2017 6:25am Mar 6, 2017 6:25am
  •  Retrogue
  • Joined Feb 2017 | Status: Member | 229 Posts
Quoting Retrogue
Disliked
Upcoming news? 3pm GMT Closed MT4 after 17:00 EST? - Yes Market in balance? - No Date: 05/03/2017 22:00 Sydney session Daily: ROMAR - Resistance EMA - Support PSAR - Support Check List: Last MACD 0 crossing -up Last EMA Alert Arrow - down Last DB Attachment up 121.160 Fibo up Notes: White and smooth crossed purple and now ema has followed in becoming support with romar resistance. The daily is in consolidation. Second Parabolic locking in uptrend. DB attached with magenta divergence on the other side of purple with a thistle price box. Candle opened...
Ignored
My trading plan was made last night at 22:00 GMT so was different but as Doves instruction my plan is valid for 24 hours.
Never Give Up
 
 
  • Post #8,400
  • Quote
  • Mar 6, 2017 6:29am Mar 6, 2017 6:29am
  •  Tortilla
  • | Joined Dec 2016 | Status: Member | 72 Posts
Quoting Cili
Disliked
{quote} Hi Retrogue, I think there are some mistakes in your trading plan: - EMA is not Support, it is resistance in H1 and H2 - Parabolic is also resistance in H1 and H2 - PSAR is resistance in H1 and H2 - MACD crossing is down in H1 and H2 - DB attachment in H2 is 120.340 - EMA arrow in H2 is down With this Setup you get a complete different Picture.
Ignored
trading plan is made 5/3 22:00pm gmt...that is why...
 
 
  • Trading Systems
  • /
  • The Paradox System
  • Reply to Thread
    • 1 418419Page 420421422 861
    • 1 Page 420 861
3 traders viewing now, 2 are members:
doddy
,
Invisible
  • More
Top of Page
  • Facebook
  • Twitter
About FF
  • Mission
  • Products
  • User Guide
  • Media Kit
  • Blog
  • Contact
FF Products
  • Forums
  • Trades
  • Calendar
  • News
  • Market
  • Brokers
  • Trade Explorer
FF Website
  • Homepage
  • Search
  • Members
  • Report a Bug
Follow FF
  • Facebook
  • Twitter

FF Sister Sites:

  • Metals Mine
  • Energy EXCH
  • Crypto Craft

Forex Factory® is a brand of Fair Economy, Inc.

Terms of Service / ©2022