HI There, How do you use the asian range in your day trading? Great stuff!!!
Ignored
I don't use it on its own, I mostly use it to denote key sessions. Sometimes I will look for a retracement back to a sup/dem area inside the AR. Having the indicator makes it easier to map out the market for me, simply.
Bullish euro, bearish dollar. Just like clockwork. I believe we can reach for the stars on EU - 1.07ish after the last significant swing high at 1.0634 got taken.
When you draw the zone on the Bearish candle prior to the bullish move on price
- is it from bottom wick to the body or upper wick to the body?
When you draw the zone on the Bullish candle prior to the Bearish move on price
- is it from bottom wick to the body or upper wick to the body?
H4 - if two zones are one on the top of each (sperated by 50-60pips), Should we assume that the second one (higher) will hold stronger or should be rely on USindex to support the decision?
Thanks. When you draw the zone on the Bearish candle prior to the bullish move on price - is it from bottom wick to the body or upper wick to the body? When you draw the zone on the Bullish candle prior to the Bearish move on price - is it from bottom wick to the body or upper wick to the body? H4 - if two zones are one on the top of each (sperated by 50-60pips), Should we assume that the second one (higher) will hold stronger or should be rely on USindex to support the decision?
Ignored
I used a simple memo-trick at first, use whichever side price is moving towards.
So if we're in a downtrend and expecting a bounce off demand - use the top wick-to-body of the bearish candle and then the other way around for supply
Hey Alex, thank you for sharing your knowledge here with us.
I just finished reading the whole thread. What a gold nugget we have here.
I took several notes but I'm still a bit confused on the process.
I think it would be beneficial if you could post the HTF and LTF image. I hope I'm not asking for too much.
On a side note, what is your views on EURUSD? I've been trying to apply what I learnt, but I'm not confident its correct. For whatever reason I foresee a huge bull move coming.
Once again, thank you for all you did here on the thread.
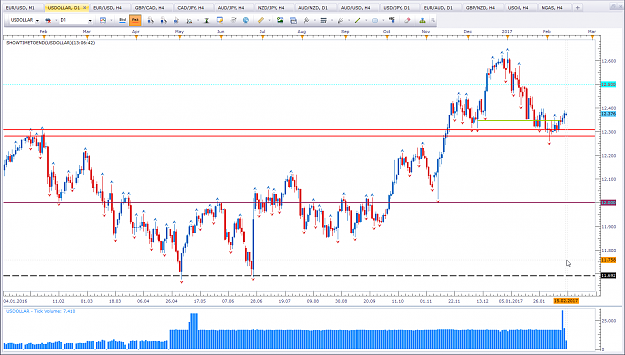
{quote} So now we've spotted key levels, areas with their respective supply and demand (sellers or buyers waiting to short or long the market), what do we do? We check to see if we can find similar traces on our correlated instruments. When it comes to EU and GU, we turn to the USDx. Now a thing to remember is, the correlation is inverse, meaning that when dollar rallies, euro and cable will decline and vice versa. How do we know if a level will hold or break? Well if we see a level that is holding on the EU, but USDx has a clear path ahead,...
Hey Alex, thank you for sharing your knowledge here with us. I just finished reading the whole thread. What a gold nugget we have here. I took several notes but I'm still a bit confused on the process. I think it would be beneficial if you could post the HTF and LTF image. I hope I'm not asking for too much. On a side note, what is your views on EURUSD? I've been trying to apply what I learnt, but I'm not confident its correct. For whatever reason I foresee a huge bull move coming. Once again, thank you for all you did here on the thread.
Ignored
Which HTF and LTF image do you mean?
As far as my EU bias, I'm bullish. Talks of rate hike may foil it, though...
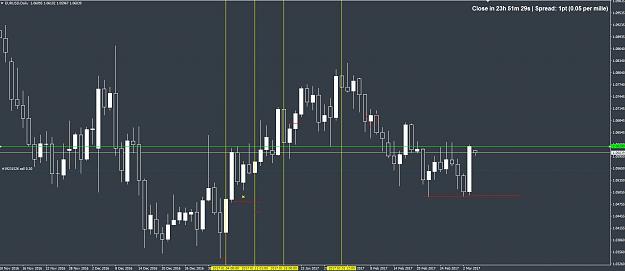
{quote} To put it in context, while the dollar is rallying, the euro and pound should be declining. Like I said, magic. {image}
Ignored
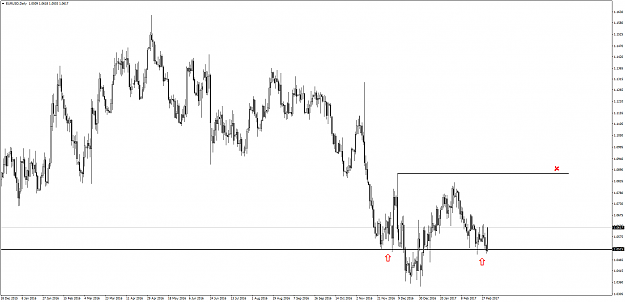
Quick question, in this example (post #17) point 3 takes the previous high. I'm assuming it took the high because there was SLs from the previous bearish trend. Is that a correct assessment? Also, breaking the previous high is a requirement to look for a setup? It almost look like a Quasimodo pattern. Is that just a coincidence?
{quote} Which HTF and LTF image do you mean? As far as my EU bias, I'm bullish. Talks of rate hike may foil it, though... {image} {image}
Ignored
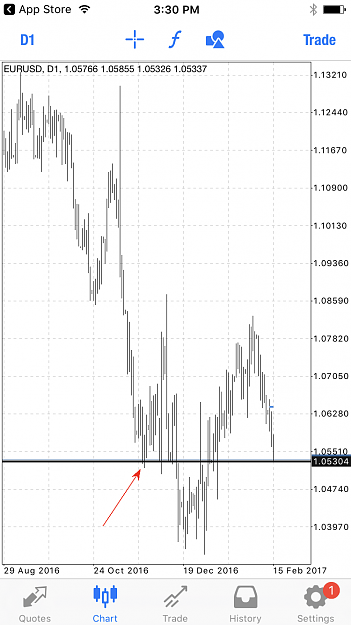
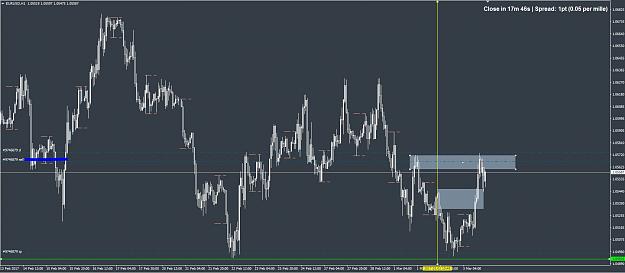
What I meant is that usually you just show the LTF. So basically your entry based on fib or price reaching the order block. But if you could show the HTF of WHY you found that setup WHEN you found it. Let me give you an example. This is a trade I took Friday. It didn't work. It went 20 pips my way with no draw-down then it reversed and took stopped me out. Clearly, there was an issue with my HTF assessment. In the image below you can see the trade. On the HTF we had a clean double bottom. So I figured there would be stops to be taken there. If im not mistaken the dollar index showed divergence. Now, in the LTF, price had reached a order block. So I entered short.
The entry on a LTF seems to be "easy". It seems like the big problem is interpreting where price is at, and what it intends to do. If you could expand more on that it would be great.
{quote} Quick question, in this example (post #17) point 3 takes the previous high. I'm assuming it took the high because there was SLs from the previous bearish trend. Is that a correct assessment? Also, breaking the previous high is a requirement to look for a setup? It almost look like a Quasimodo pattern. Is that just a coincidence?
Ignored
When price breaks a significant swing, there are three things that should be going thru our minds:
Number 1: Market Structure has shifted, we're expecting a turn in price direction....
Number 2: It was a fakeout and liquidity above or below the swing was snatched, we're expecting price to resume its trend...
Number 3: A Swing was taken, so price is more likely to run the other way at least at first.
When you get enough chart hours you will begin to see it for yourself, and more importantly you'll begin to know which one it is. Usually, in a neat trend with higher highs and higher lows /// lower lows, lower highs, price will eventually f**k the swings up at some point... What you need to find out then is, is the trend still strong or is it weakening because we have confluencing KSR on two or more correlative instruments, or because some stuff is going on in the yield markets or whatever the reason.
Usually, as a rule of thumb, double bottoms and tops are extremely suspicious to me... Once you see that, or even better if there are more than two, you'd better be sure that price is gonna go for that.
{quote} What I meant is that usually you just show the LTF. So basically your entry based on fib or price reaching the order block. But if you could show the HTF of WHY you found that setup WHEN you found it. Let me give you an example. This is a trade I took Friday. It didn't work. It went 20 pips my way with no draw-down then it reversed and took stopped me out. Clearly, there was an issue with my HTF assessment. In the image below you can see the trade. On the HTF we had a clean double bottom. So I figured there would be stops to be taken there....
Ignored
Oh yeah, I show the LTF, but I've put it in context beforehand. I just never realized it was spread out all over the thread. I share my bias every now and then, and every post I make showing my trades I just base it off that bias.