Hi. It's one of my first post in this forum and I want to share nice strategy for develop by more experience traders. I find it somewhare and it's not my script or work. Hope we can develop it for ultimate system for forex. Now something about The system. Best and only timeframe for trading with this is H4. I play this strategy long time ago (last vacation) and have 68 wins and 30 losse with risk ratio around 1:1 or even better. I don't have screens couse I trade on demo account. Last time I play on this and make 1000 bucks on half week but loss it couse not fallow and break rules. It has great potential but need some - maybe more filters. Hope some guys will help improve it. If you have any question, please not hesitate to ask.
Trading System Only profit is a trend strategy. Signal analysis of the indicators used, allows to determine precisely the direction of the price movement at different time intervals and at the right moment to enter the market. The system automatically determines the appropriate moments for transactions, which significantly facilitates the work of the trader.
This policy has caused great interest among traders in the Russian and international forums.
Indicators used in the system:
1) 1-2-3 Pattern MTF v3.1.mq4
2) IBFX - CPR.ex4
3) TRO_InsideBar_Plot2.mq4
The archive has a template with the recommended settings.
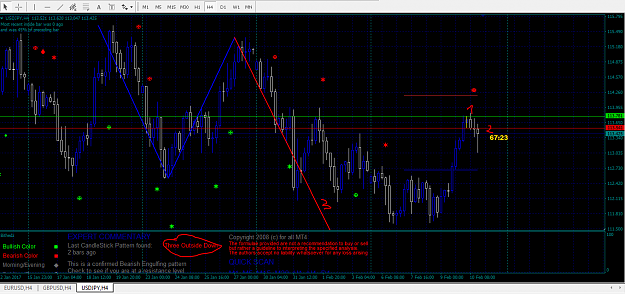
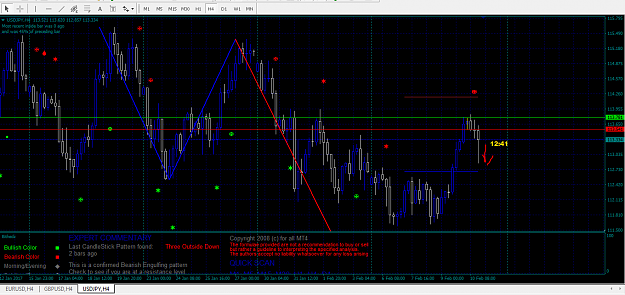
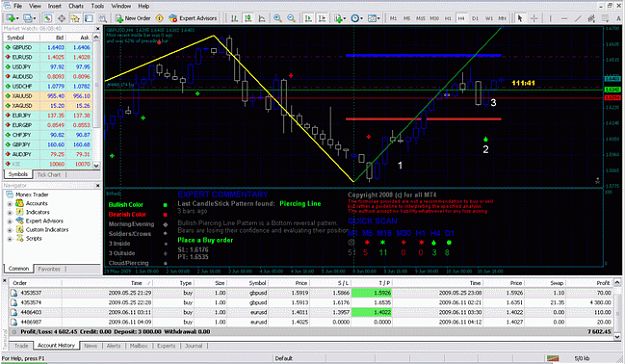
Indicator 1-2-3 Pattern MTF v3.1.mq4 determines the current direction of the trend. Based on the recommendations of the authors, trade is conducted on the range H4 and M30. In the interval H4, the indicator shows the trend on the daily interval (D1), to the M30 - H4.
Image is cost trend direction in the form of a zigzag of 3 lines.
Zigzag of 2 yellow and 1 green line shows upward movement. We are interested in the direction of the last green line. The green line indicates the opening position to buy.
Zigzag of 2 blue and 1 red line shows the downward movement and said that the preferred sale. We are interested in the last red line
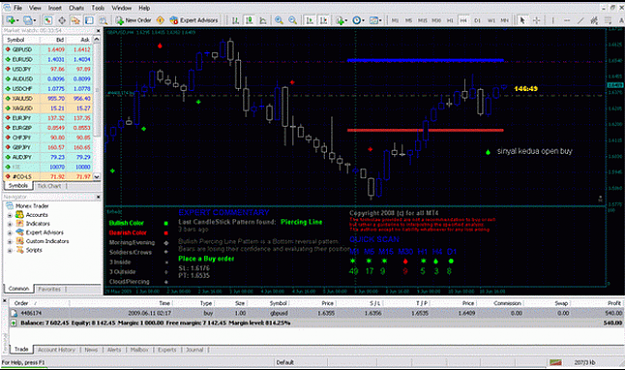
Indicator IBFX - CPR - Information indicator determines the pattern at the current time. In determining the pattern, the indicator shows a recommendation to buy or to sell (Place a Buy order, Place a Sell order). pattern icons plotted on a graph indicator. It should be noted that the light patterns is determined not only on the current time frame, but also on other (intervals and patterns of icons arranged in the indicator window).
Also, the indicator on the chart shows the levels of Take Profit and Stop Loss blue and brown, respectively.
TRO_InsideBar_Plot2 indicator - plotted two horizontal lines of green and red. These lines are formed above the current price (green), and under the price (red). The breakdown of the cost of the green line is a signal to buy (Buy), a sample of red - Sales (Sell).
These signals are analyzed in conjunction with other signals of the system, and then a decision on the transaction.
So, sum up the above said, and define steps for analyzing signals from the trading system.
Consider the deal to buy (Buy):
1) The graph indicator IBFX - CPR gets green icon that signals a purchase. In the chart window appears the inscription Place a Buy order of green color with the level of the recommended values of Stop Loss and Take Profit.
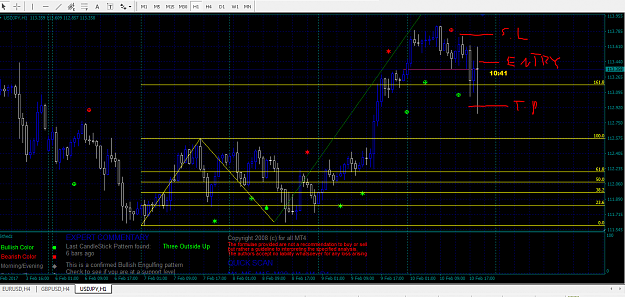
2) Determine the direction of the trend on the indicator LED 1-2-3 Pattern MTF v3.1. We need him to show a zigzag yellow-green color. Verifies the direction of the trend on the chart H4 and M30. If the direction of the rising (green line zigzag pointing upwards), then we go on.
3) Watch the entry point into the market to buy. Namely, a horizontal line above the current price, which is plotted TRO_InsideBar_Plot2 indicator. Put a warrant to purchase breakdown level (Buy stop) above the green line on the 1 point, set the recommended levels of Stop Loss and Take Profit.
Steps to a deal to sell (Sell) are similar, but in reverse.
ALL INDICATORS IN RAR FOR UNPACK:
Trading System Only profit is a trend strategy. Signal analysis of the indicators used, allows to determine precisely the direction of the price movement at different time intervals and at the right moment to enter the market. The system automatically determines the appropriate moments for transactions, which significantly facilitates the work of the trader.
This policy has caused great interest among traders in the Russian and international forums.
Indicators used in the system:
1) 1-2-3 Pattern MTF v3.1.mq4
2) IBFX - CPR.ex4
3) TRO_InsideBar_Plot2.mq4
The archive has a template with the recommended settings.
Indicator 1-2-3 Pattern MTF v3.1.mq4 determines the current direction of the trend. Based on the recommendations of the authors, trade is conducted on the range H4 and M30. In the interval H4, the indicator shows the trend on the daily interval (D1), to the M30 - H4.
Image is cost trend direction in the form of a zigzag of 3 lines.
Zigzag of 2 yellow and 1 green line shows upward movement. We are interested in the direction of the last green line. The green line indicates the opening position to buy.
Zigzag of 2 blue and 1 red line shows the downward movement and said that the preferred sale. We are interested in the last red line
Indicator IBFX - CPR - Information indicator determines the pattern at the current time. In determining the pattern, the indicator shows a recommendation to buy or to sell (Place a Buy order, Place a Sell order). pattern icons plotted on a graph indicator. It should be noted that the light patterns is determined not only on the current time frame, but also on other (intervals and patterns of icons arranged in the indicator window).
Also, the indicator on the chart shows the levels of Take Profit and Stop Loss blue and brown, respectively.
TRO_InsideBar_Plot2 indicator - plotted two horizontal lines of green and red. These lines are formed above the current price (green), and under the price (red). The breakdown of the cost of the green line is a signal to buy (Buy), a sample of red - Sales (Sell).
These signals are analyzed in conjunction with other signals of the system, and then a decision on the transaction.
So, sum up the above said, and define steps for analyzing signals from the trading system.
Consider the deal to buy (Buy):
1) The graph indicator IBFX - CPR gets green icon that signals a purchase. In the chart window appears the inscription Place a Buy order of green color with the level of the recommended values of Stop Loss and Take Profit.
2) Determine the direction of the trend on the indicator LED 1-2-3 Pattern MTF v3.1. We need him to show a zigzag yellow-green color. Verifies the direction of the trend on the chart H4 and M30. If the direction of the rising (green line zigzag pointing upwards), then we go on.
3) Watch the entry point into the market to buy. Namely, a horizontal line above the current price, which is plotted TRO_InsideBar_Plot2 indicator. Put a warrant to purchase breakdown level (Buy stop) above the green line on the 1 point, set the recommended levels of Stop Loss and Take Profit.
Steps to a deal to sell (Sell) are similar, but in reverse.
Attached Image (click to enlarge)
Attached Image (click to enlarge)
ALL INDICATORS IN RAR FOR UNPACK:
Attached File(s)