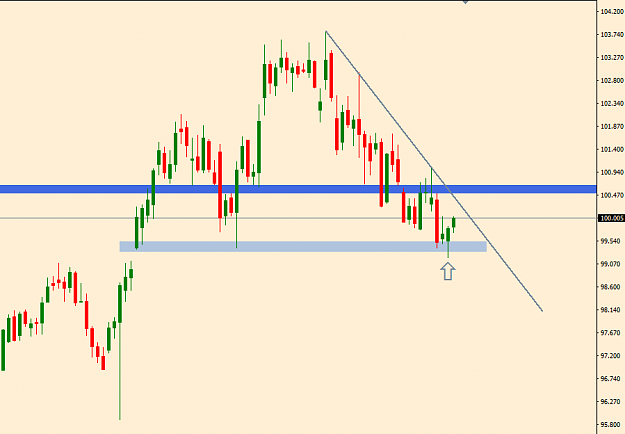
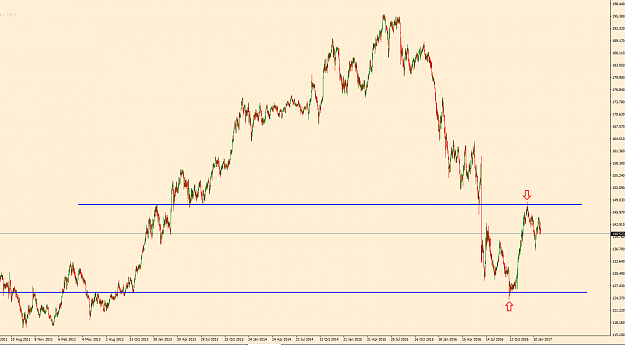
US Index daily chart. A follow on from Post #278, still an interesting an area to watch for another entry, price rejected the trouble area (arrowed), now we have a ppz, a strong support area, a trendline and a BRN all in the mix.
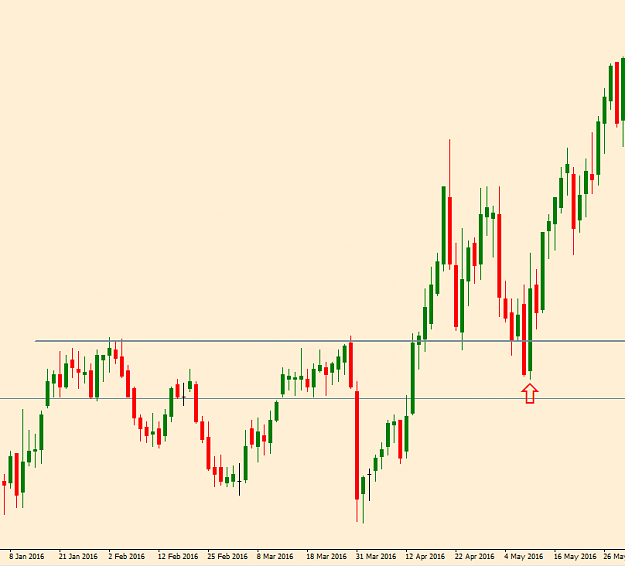
Wheat Futures 4 Hour chart, a follow up chart to Post #261. Just to show how price can carry on reacting to a line on your chart, it really can be that simple, I should really do more follow ups on some of the charts I post, the power of bare charts with a line or two shouldn't be underestimated, patience and more patience will reward you.
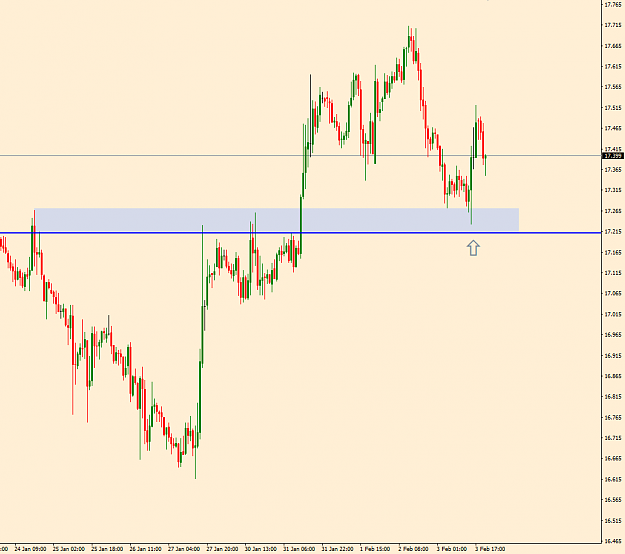
Silver 1 hour chart. A follow up to Post #280, on the 4 hour chart, price returned to the ppz and there was a BUOB on the 1 Hour chart below. Have to remember these are zones (as the name suggests - Price Pivot Zone).
Attached Image (click to enlarge)
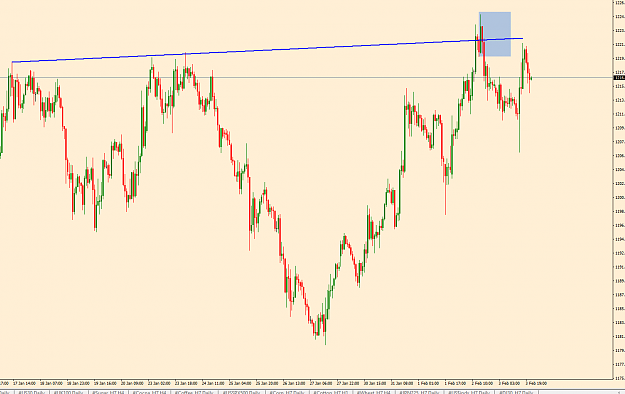
Gold 1 Hour chart. There was also an opportunity to short Gold on the 1 hour chart at this false break cum supply zone. I don't think I posted this chart previously, not here anyway.
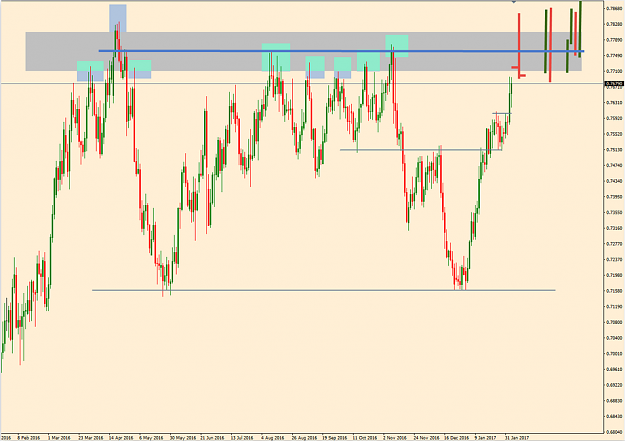
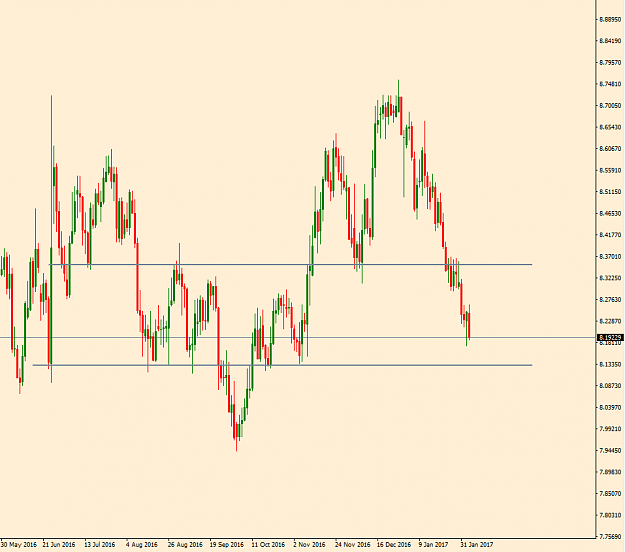
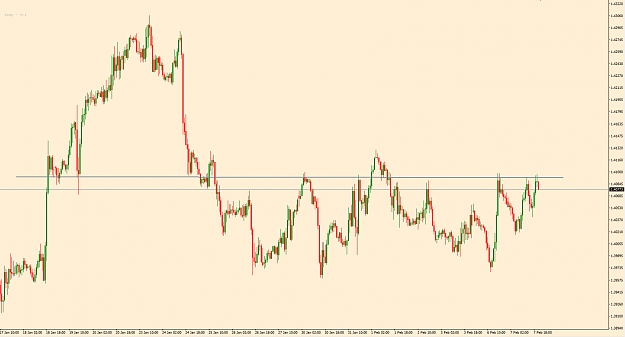
GBPJPY Daily chart. A re visit to Post #12 from July 31st 2016, just to show how important a couple of lines on your chart can be, once you learn how to plot the IMPORTANT levels you'll be one step ahead. Wait for price to reach them and wait for price action.
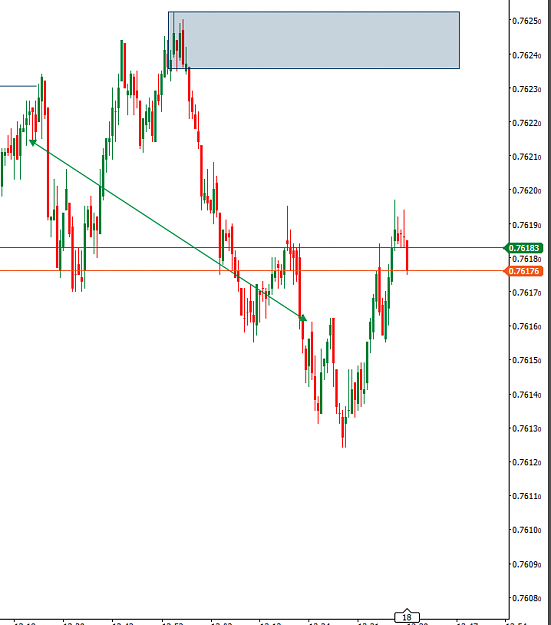
I am also looking at this pair but I was using the daily chart, I am somehow with doubts when to open the trade since I am starting to realize that if I wait for a price action signal I will lose most of the move, what do you think?
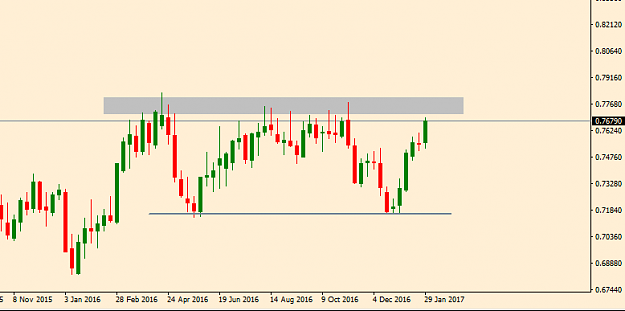
I am wondering if it works if we place immediately a pending sell as soon as it touches the 0.76790 level on your chart, its such in a higher level... whats your view?
I just went over many of your charts, thank you so much for sharing them!
Thanks migmac. The first thing is, it's a zone, you can't really touch trade areas like this, it's a wide zone, it's an area where price has reacted before, nothing more. I wait until price gets into this area and then see what happens, you can't take a trade before price action, it's the price action that shows you the intent, whether it's a pinbar, outside bar or whatever. I have drawn a line in blue which I would be willing to trade off and three crude depictions of what I'd be looking for.
Never worry about 'losing' out on a move, you need to make sure there's a good probability of a move in the first place. Correct this way of thinking, it's important!
If price breaks through it I want to see a retrace before thinking about a buy trade.
If there is a pinbar or BEOB, it's got to cut through the whole zone to convince me.
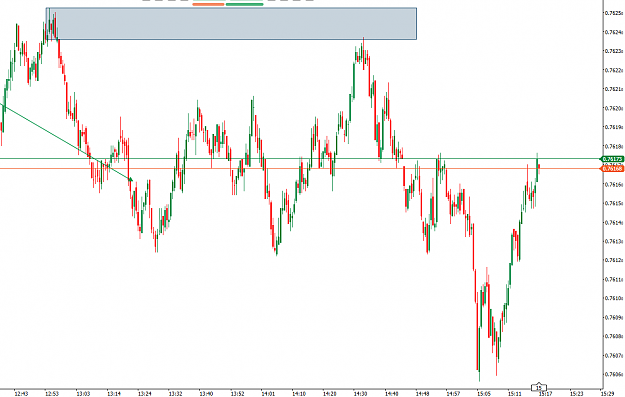
Other type of rejection of the area, a break through and instantly dropping back under the area (like a two or three day pin bar)
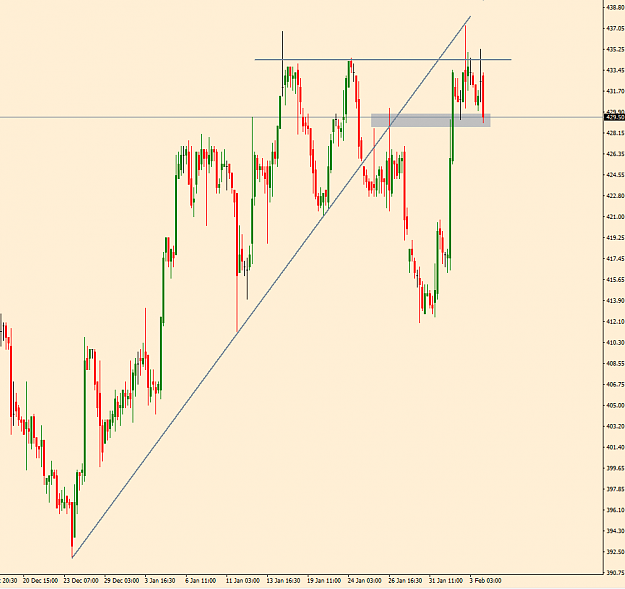
There are other examples on my journal but I thought I'd post this to, a ppz where price has broke through and immediately turned back (a 2 bar pinbar). You can look for these at anywhere where price has reacted before, flip zones, tops and bottoms of 'boxes' (a failed breakout).
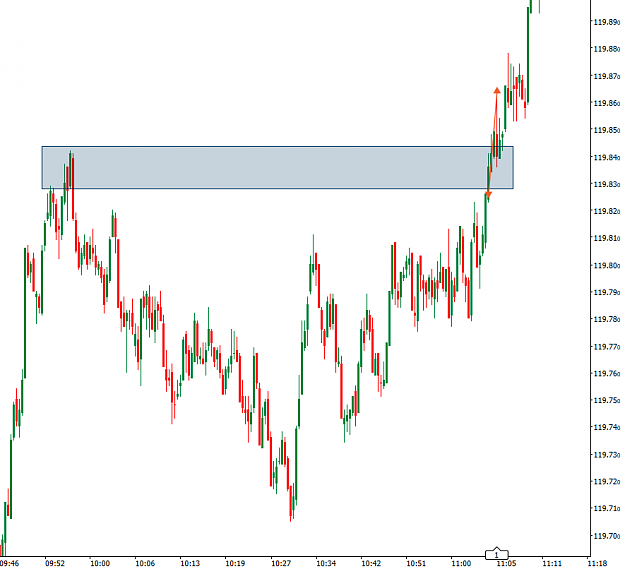
AUDUSD 34 tick chart, just a rectangle where I think price will turn, the setup is probably familiar, plenty of them about to trade. Had a couple of winners and a loser today, didn't take this one as I was away. It can be simple if you want it to be, not always easy but simple. (Ignore the deal map).
EURJPY 34 tick chart, a losing trade, I got it all wrong, I understand why it was a bad trade, although there was an entry there. I also hung on too long and paid for it.