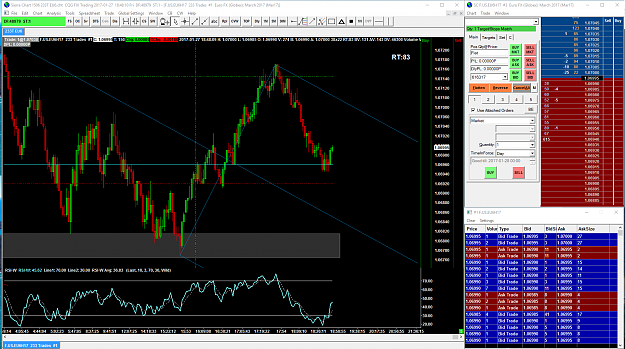
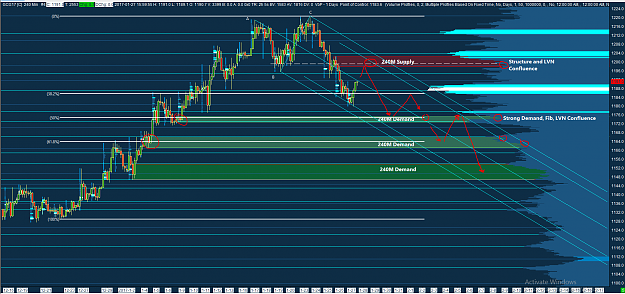
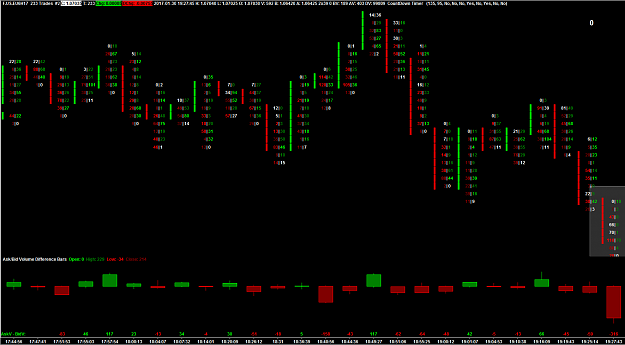
Reading some of the last few posts some of you are using Sierra. Now I'm in no way saying do not use Jigsaw or OFA etc but Sierra is for me very good - it gives a very good volume profile and footprint for free, also TPO if need be. So if you are starting off you can save splashing the cash and cut your teeth looking at the free stuff.....
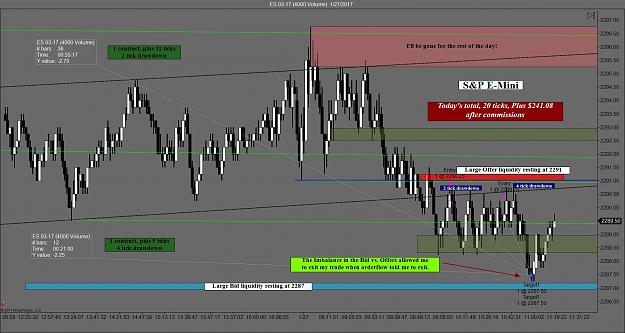
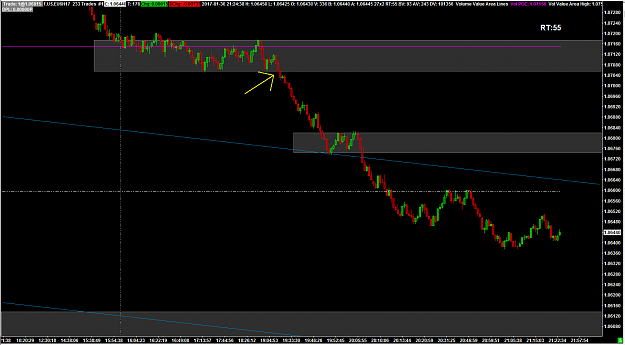
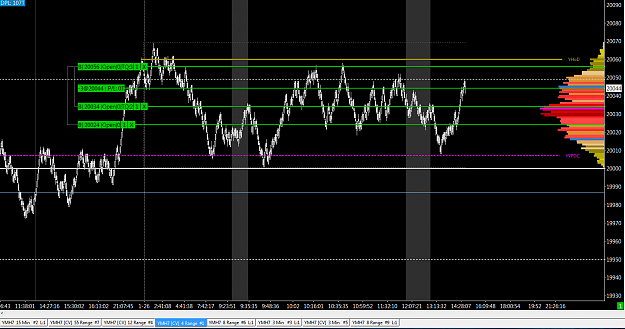
My last trade from yesterday....
My last trade from yesterday....
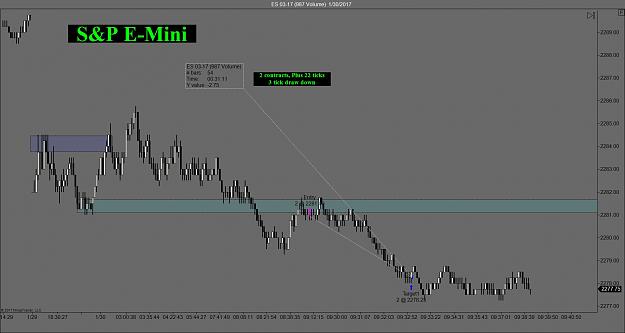
Attached Image (click to enlarge)
It's a dirty job but someone's gotta do it!