Significant Price Points with Multiple Time Frame Support (also fixed bugs of previous version) SPP_MTF.png;2132319 {file} {image}
Ignored
Nice one abokwaik, but can we have the horizontal lines drawn like rays so we can see where are the starting points of every level for further analysis? Also explain for every setting exactly what is their meaning example, what Weight: Reverse Point means.
{quote} Nice one abokwaik, but can we have the horizontal lines drawn like rays so we can see where are the starting points of every level for further analysis? Also explain for every setting exactly what is their meaning example, what Weight: Reverse Point means.
Ignored
Explanation of terms used:
Reverse : if the price point is at the top or bottom of the candle wick, which means that price touched, was not able to cross, and then reversed.
Wick : if the price point is part of the candle wick, which means price crossed the point but could not close behind it.
Body : priced crossed the point and closed behind it.
As for the ray option, it would be difficult using the current coding logic.
But I will do it after the project completes if this indicator got selected as the "Best S/R Indicator".
Note that when you place the cursor on any line a tooltip appears showing its time frame and power.
What this indicator needs is a separation of support and resistance lines, because some times and based on the number of lines you select it may show lines only below or only above the current price, so I need to separate the calculation/filtration into two parts, one above the price for resistance lines and one below the price for support lines.
Since price is not 100% likely to reverse at the S/R levels, I figured that it is much better to use something that dynamically reforms to pick up the tops and bottoms and have lower SL target with bigger target profit. I am using this on a 100 - 25 pips median Renko range bars. Image1.png;2132883 I hope it helps in some way. {image} {file}
Ignored
this renko channal is changing when new low or high gets ...
Success is a Journey Not a Destination....... kind regards ramzam
{quote} ATR Based Support and Resistance Lines EURUSDH1.png;2132563 @GoldTheHun : Kindly Check is this is true. I noticed that 5Min ATR value (7 in your example) is missed from the formula, so I added it in my calculations. formula used for daily support 1 is =DailyOpen - M5ATR(1440)*1*Sqrt(1440/5) formula used for daily support 2 is =DailyOpen - M5ATR(1440)*1.28*Sqrt(1440/5) and so on .. {image} {file}
Ignored
The formula is correct. Thank you for coding it.
Best
{quote} Here ... I hope you find it useful. Please note that this is not a normal indicator, so we do not need to perform calculations on every tick. {file}
Ignored
oh.. is it possible to perform calculations on every tick or every particular time frame ...
actually i have one indicator.. but it is giving more signals whenever the said time frame of the charts open and close .. can you fix this to give alert only on the green arrow or red arrow appears .. and if this calculation possible at particular time like 1 minute or 5minute means so good.. it wont give repaint i think.. i attached the indicator name is megafx on anticipate of getting help but i am sure i am not deviate the main core of the thread..
and i have sinewave support and resistance indicator.. which is useful means you please use for this bring the best support and resistance
it gives nice sup and res. but when price break support fall is good ... break res upside is good
{quote} ATR Based Support and Resistance Lines EURUSDH1.png;2132563 @GoldTheHun : Kindly Check is this is true. I noticed that 5Min ATR value (7 in your example) is missed from the formula, so I added it in my calculations. formula used for daily support 1 is =DailyOpen - M5ATR(1440)*1*Sqrt(1440/5) formula used for daily support 2 is =DailyOpen - M5ATR(1440)*1.28*Sqrt(1440/5) and so on .. {image} {file}
Ignored
I downloaded the indicator and checked the calculation in the code, it is perfect. Thanks once again Khalil.
Usage:
When the prices are between daily support(0), resistance(0), they will try to reach support(1) or resistance(1).
If they stay within support(0), resistance(0), the market is neutral.
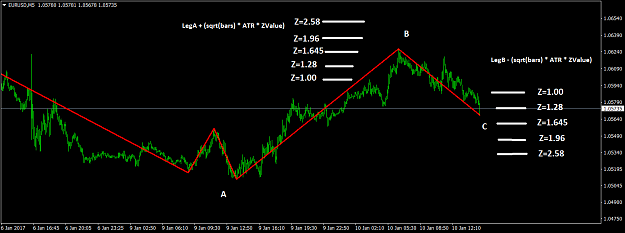
Here is a dynamic version of Support and Resistance based on ZigZag
Attached Image (click to enlarge)
We again calculate ATR(1400) for 5 minute time frame. Than we do the calculations seen on the pic, counting the bars on ZigZag legs. This would be dynamic calculation showing the expected turning point of the live leg of the zigzag.
Hope it is clear.. This should be very interesting..
We could expand this logic for other time frames on chart:
1 Minute = ATR(7200) (1 week)
5 Minute = ATR(1400) (1 week)
15 Minute =ATR(480) (1 week)
30 Minute= ATR(240) (1 week)
1 Hr = ATR(528) (1 Month)
4 Hr = ATR(132) (1 Month)
1 Day=ATR(132) (6 months)
Or user selectable ATRperiod
Khalil, Here is a dynamic version of Support and Resistance based on ZigZag EURUSDM5.png;2133317 We again calculate ATR(1400) for 5 minute time frame. Than we do the calculations seen on the pic, counting the bars on ZigZag legs. This would be dynamic calculation showing the expected turning point of the live leg of the zigzag. Hope it is clear.. This should be very interesting.. We could expand this logic for other time frames on chart: 1 Minute = ATR(7200) (1 week) 5 Minute = ATR(1400) (1 week) 15 Minute =ATR(480) (1 week) 30 Minute= ATR(240)...
Ignored
nice idea to accumulate buy and sell ..... and go on trade in profits
Success is a Journey Not a Destination....... kind regards ramzam
perfect it is .. but any differentiation between res and sup... like dotted line and dash line or in color... anything as per your best knowledge {image}
Ignored
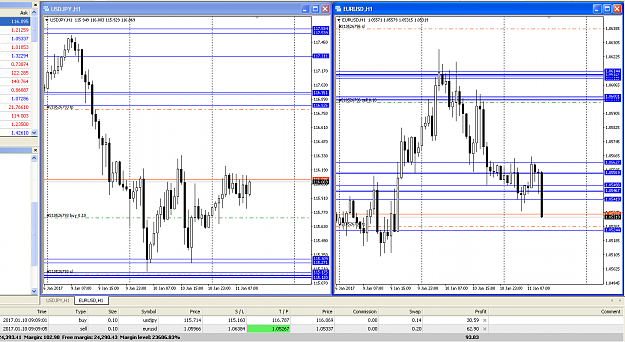
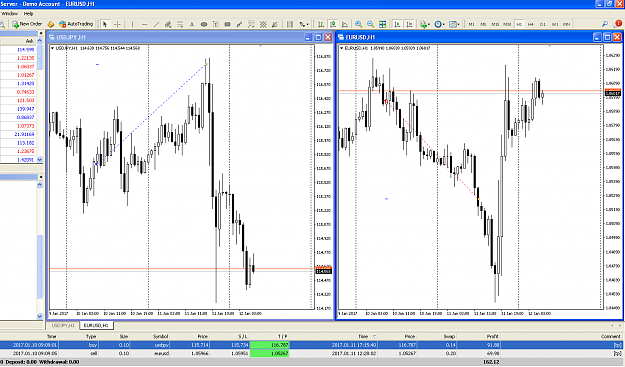
Those lines have different roles at different times, if they are below the price we expect them to act as support, if they are above we expect them to act as resistance.
My approach is to not to trade the touch of these lines, but to trade the price action around these lines.
The screen shot I posted this morning (check previous page) was taken real time after price bounced at these lines with convening reversal formation.
These two trades reach 90+pips some time today, and never hit SL (above formation high for EURUSD and below formation low for USDJPY), and they are currently at around 45 pips in profit.
So actually color coding support and resistance is not necessary, and could also be not meaningful as they switch roles. However, I raised point special to this indicator on post 142 above :
Quote
Disliked
What this indicator needs is a separation of support and resistance lines, because some times and based on the number of lines you select it may show lines only below or only above the current price, so I need to separate the calculation/filtration into two parts, one above the price for resistance lines and one below the price for support lines.
Because this indicator is based on number of touches/breaks of "ALL" price points on the chart, and then showing only limited number of lines "based on Show Lines settings", so we might end up having all significant price points at one side of the price, which might look weird as it could mean that there is nor resistance or not support. So I am gonna add that feature, although I don't find it that weird when we get resistance only or support only lines, as it could be a nice indication to not trade the other way .
One other important feature the "SPP" indicator is still missing, and I added it as an input "for future use" to remind myself to code it is the Accuracy Points, or better named as Merge Level.
Currently the indicator treats each price point individually, while my idea at the beginning of the thread was the "zone" concept, where I will merge adjacent SPPs (Significant Price Points) into one SZ (Significant Zone).
The indicators developed in the thread so far can be considered by-products in the process of building the final product, which btw could be a combination of different concepts (fractals, fibs, SPPs, pivots ,,, etc), where confluence zones are highlighted.
{quote} Those lines have different roles at different times, if they are below the price we expect them to act as support, if they are above we expect them to act as resistance. My approach is to not to trade the touch of these lines, but to trade the price action around these lines. The screen shot I posted this morning (check previous page) was taken real time after price bounced at these lines with convening reversal formation. These two trades reach 90+pips some time today, and never hit SL (above formation high for EURUSD and below formation...
Ignored
understood... but late seen this indicator today and missed to book profit at bottom line in oil...
but can you differentiate with time frame lines... it means 4 hr lines will be in dot. day lines in dash and weekly lines in dashdotdot.. so that it is easy to view and memory that i am watching 4hrs or daily lines ... h1 is solid
Success is a Journey Not a Destination....... kind regards ramzam
One other important feature the "SPP" indicator is still missing, and I added it as an input "for future use" to remind myself to code it is the Accuracy Points, or better named as Merge Level. Currently the indicator treats each price point individually, while my idea at the beginning of the thread was the "zone" concept, where I will merge adjacent SPPs (Significant Price Points) into one SZ (Significant Zone).
Ignored
yes this will be good to see as like zone instead of few lines in the particular price... all are merging so zone is good
but when we see in a particular time frame like m15 or m5 and the spps for h1 and h4 and day and week.. then only come to new idea. so for differ need line style is important... so in indicator please proide line style ... then it will be good
Success is a Journey Not a Destination....... kind regards ramzam
yesterday i found few indicator based on fibo for morning flat. but few are not display or i dont understand its display... but aib indicator is good but it also showing in 5 min time frame only..
idea i will tell after this aib indicator works on all time frames ... because i could not able to change any time frame and disappears.
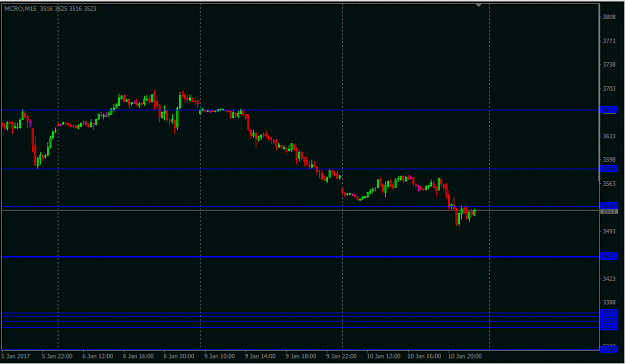
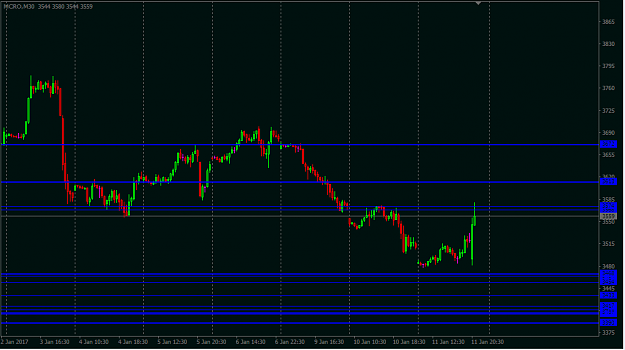
Took crudeoil mcx short at 3561 but ... 3568 and 3574 levels meet. I put this at current time and chart time frame is m30..
Placing order at 3468.... Will see.. And as of this h1 lines will be in dashdotdot
h4 lines will be in dot style and
day lines will be at dash and
week lines at dashdot lines can attach more than 2 time ... To view diff
Attached Image (click to enlarge)
Success is a Journey Not a Destination....... kind regards ramzam
Hi abokwaik I think this indicator will suitale for you. Try it you will see which one need modify I used it with 240 mins only, look back 21 bars Green pips for u Cheers SR Levels v1.1.mq4;2130553USDJPYH1.png;2130551 {image} {file}
Ignored
Hi Anthony_sg,
I like your Oanda Order Book there on your chart.. is that an indicator?
regards
Since Frank Sinatra sings in his own way, my chart sing... I did it, my way