{quote} Thanks for your input ... The method you described looks more robotic than human ... it would be too difficult (for my brain) to count/add/subtract the touches at each price point ... Are you sure you are a human Well, one "human" way I know about is to scan the time frames from top to down ... So if we are trading H1, we start with the Monthly and plot S/R lines where price reverses ,,, then we do the same on the Weekly, Daily, H4, and we flag each level by its time frame code.
Ignored
I would beg to differ... I think you underestimate the power of your brain and how it can scan a chart and see this criteria. Nonetheless, if you want to find support and resistance based on nothing other than how a real trader would mark it down on his/her charts this is the best approach (I know of).
{quote} If you code an algo to do what a human does when they draw SR, that's when you would get the most significant result. So how do humans draw SR? Well, when looking at a chart we basically look for: for each price point{ for each bar on the chart{ if the candle shadow touches the price point then we add weighting to the price point if the price reverses at the price point we add more weighting if there is generally a lot of candle bodies at the price point we subtract weighting You don't need fuzzy logic you just need the right algo
Ignored
But why a shadow?
a shadow indicates a strong movement(determined on lower tf perhaps) so IF and only if that movement happens without any significant retrace then it = untouched support/resistance
once it comes back to that area and touches up then it is ready to decide its next move
i was taught that s/r can be done that same way on a line chart also.... post 100 http://www.forexfactory.com/showthre...19#post8398819 links to the indicator by Clara that utilizes line chart s/r if i remember correctly
Khalil post 82 ihttp://www.forexfactory.com/showthread.php?p=8396717#post8396717 ndicator never got completed... perhaps it is helpful to you
One may also wish to consider that perhaps the most important S/R is when Multiple pairs make a significant move/turn around at the same time as tha tindicates whole market sentiment
{quote} But why a shadow? a shadow indicates a strong movement so IF and only if that movement happens without any significant retrace then it = untouched support/resistance once it comes back to that area and touches up then it is ready to decide its next move i was taught that s/r can be done that same way on a line chart also.... post 100 http://www.forexfactory.com/showthre...19#post8398819 links to the indicator by Clara that utilizes line chart s/r Khalil post 82 ihttp://www.forexfactory.com/showthread.php?p=8396717#post8396717...
Ignored
Because most of these SR lines are pivot points of some sort - be it a major Fib from a large TF, a Monthly/Weekly pivot point, or even a various confluence of factors. The neat thing is that these areas can persist for years. I studied the way I would manually draw SR without any other method than a line and a chart and with many various models of abstraction this was the most effective method. I think of manually finding SR (or pivots) like an MRI. You scan from the top down, pip by pip - layer by layer, and test each price point against a model to find the exact price point to the pip that has the strongest reversal price action.
In my algo there are three criteria. Two simple are shadow or body, and the third is a reversal pattern. You're welcome to try it and see for yourself. I posted a demo script on this post. http://www.forexfactory.com/showthre...24#post9414024
{quote} Because most of these SR lines are pivot points of some sort - be it a major Fib from a large TF, a Monthly/Weekly pivot point, or even a various confluence of factors. The neat thing is that these areas can persist for years. I studied the way I would manually draw SR without any other method than a line and a chart and with many various models of abstraction this was the most effective method. I think of manually finding SR (or pivots) like an MRI. You scan from the top down, pip by pip - layer by layer, and test each price point against...
Ignored
I didn't get your meaning
I'm pretty sure the author of this thread wishes to have whatever is best coded. Please if you wouldn't mind to clarify.
{quote} Because most of these SR lines are pivot points of some sort - be it a major Fib from a large TF, a Monthly/Weekly pivot point, or even a various confluence of factors. The neat thing is that these areas can persist for years. I studied the way I would manually draw SR without any other method than a line and a chart and with many various models of abstraction this was the most effective method. I think of manually finding SR (or pivots) like an MRI. You scan from the top down, pip by pip - layer by layer, and test each price point against...
Ignored
OK Nicholishen, you got my attention.
I will try to code your idea.
{quote} I posted one mod TRo indi that I got here, free on FF I don't pay for indicators, I make my money trading, not selling mod inids and since you are not TRO, its non of your business....
Ignored
It is all of our business.
When someone contributes we should respect their wishes.
To violate their wishes may bring an end to their generosity.
Shame on you.
My Threads: Trading is as simple as 1-2-3, Highest Open / Lowest Open Trade
I personally use the following method which I have devised myself, reading the theory about random walks. And it is fairly accurate. It is about anticipating the future expected support and resistance, not past.
There are 2 time frames involved, daily expected SR and weekly expected SR.
Daily:
We use ATR(1440) of 5 minute time frame.
For daily we find = sqrt(1440/5) *ATR(1440) and multiply it with z-scores of 1, 1.28, 1.645, 1.96, 2.58 and add and subtract from daily open price.
For weekly we find = sqrt(7200/5) * ATR(1440) and multiply it with z-scores of 1, 1.28, 1.645, 1.96, 2.58 and add and subtract from weekly open price.
These would be the anticipated SRs for each day and each week.
Strongest SR tends to be when SRs make a confluence.
I also use the 5 day rolling SR, where I apply the above weekly formula to the open of 5 days ago..
It is about anticipating the future expected support and resistance, not past.
Ignored
Fibonacci Fans (trendlines drawn through the fib retracement levels from the first swing) are great at predicting where and how price will move in the future.
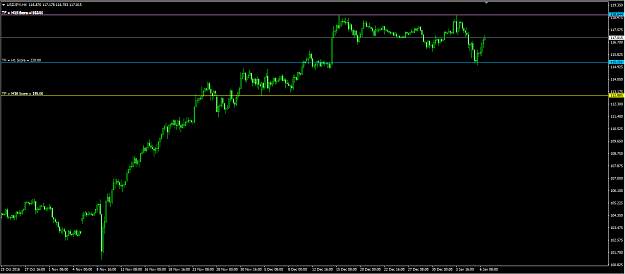
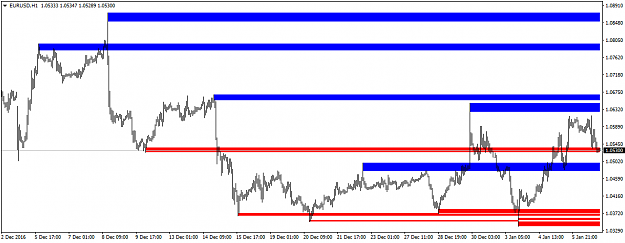
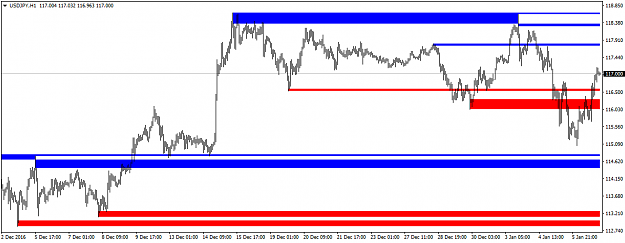
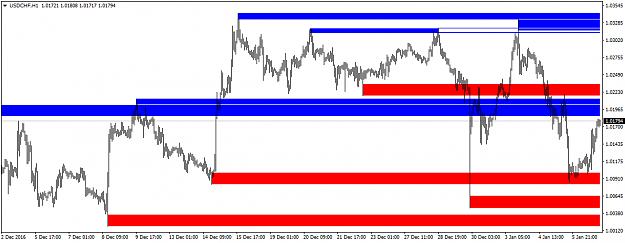
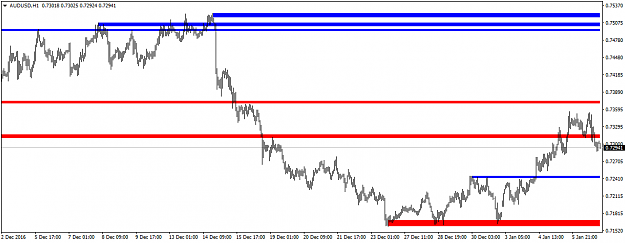
Do these make any sense ? H1 TF EURUSDH1.png;2130128 USDJPYH1.png;2130130 GBPUSDH1.png;2130133 USDCHFH1.png;2130136 AUDUSDH1.png;2130139 {image} {image} {image} {image} {image}
Ignored
nothing and
interested on this work with you
Success is a Journey Not a Destination....... kind regards ramzam
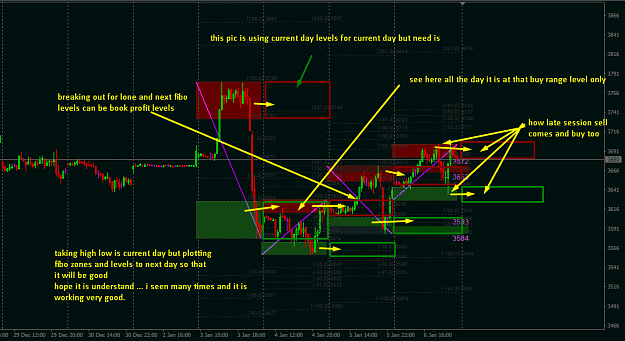
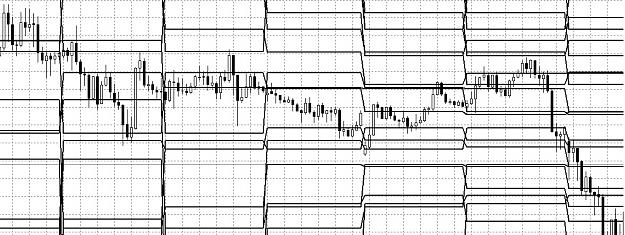
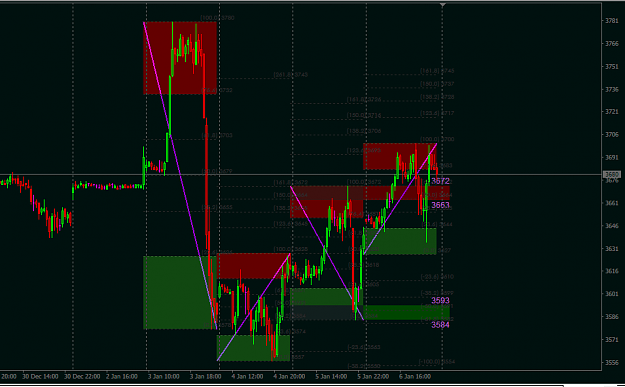
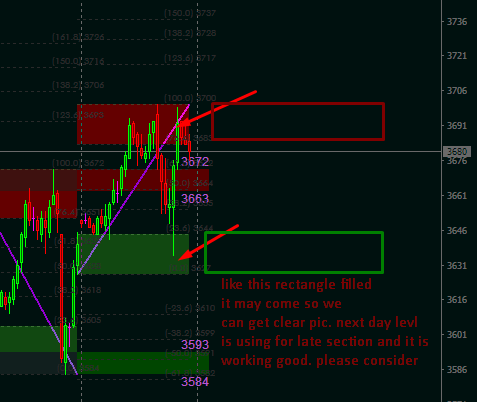
Lukeb helped me this too... Like this pic if calculated zone is comes for next day it will be good .. To decide after half of market time over {file} {file} {image}
Ignored
but i feel this one is good.
but next day level band of red and green must be come
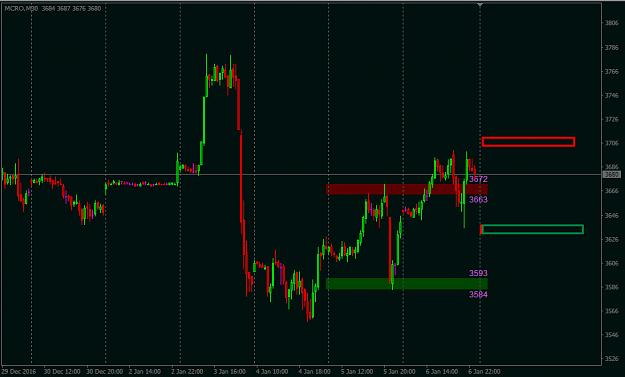
actually i made request on this indicator with no gmt time feature and based on previous day high low .... for current day Lukeb bro did this for me ..... i attached this pic which giving possible buy and sell zone as per my observation.
but need to change some settings
this indicator draws current day fib levels for current day and giving minimum 3 or 5 days pic...
but need is taking previous days high low levels and plot fibo zones and levels to current day and take current day levels and plot in next day area which is blank means one day in advance. see the 2nd pic... so that able to come.. it will give good sense of buy and sell and above red zone it is breakout buy and below green zone it is breakout sell.. as per my observation
Do these make any sense ? H1 TF EURUSDH1.png;2130128 USDJPYH1.png;2130130 GBPUSDH1.png;2130133 USDCHFH1.png;2130136 AUDUSDH1.png;2130139 {image} {image} {image} {image} {image}
I personally use the following method which I have devised myself, reading the theory about random walks. And it is fairly accurate. It is about anticipating the future expected support and resistance, not past. There are 2 time frames involved, daily expected SR and weekly expected SR. Daily: We use ATR(1440) of 5 minute time frame. For daily we find = sqrt(1440/5) *ATR(1440) and multiply it with z-scores of 1, 1.28, 1.645, 1.96, 2.58 and add and subtract from daily open price. For weekly we find = sqrt(7200/5) * ATR(1440) and multiply it with...
Ignored
Very good, indeed.
By this way we can calculate intraday levels, I think.
However I have a question - you use multipliers of 1.28, 1.645, 1.96. Why are exactly these? Are these calculated or found empirically?