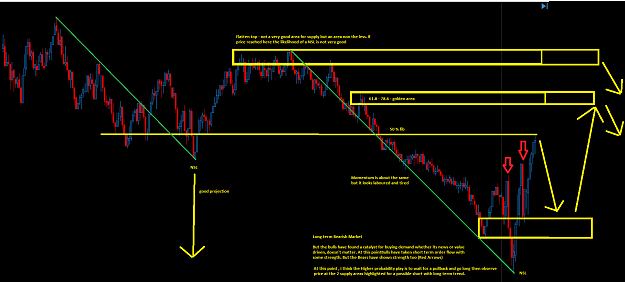
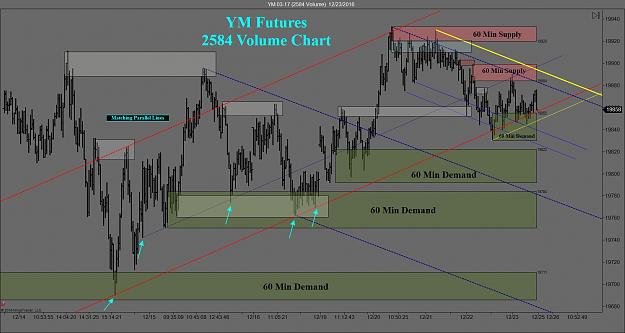
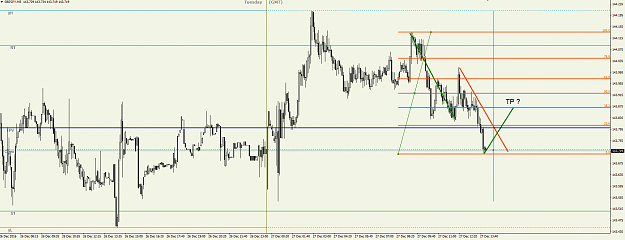
DislikedThat said, here is a little quiz of sorts to the thead for over the holiday slow period. You are looking at the PA in the chart below in real time. Question is - What do you do? What do you make of it? What is your analysis and how would you go about trading it, if you would? Feel free to mark up the chart I've provided. Thank you for any opinions! {image}Ignored
I would want to get into a trade where the short term order flow and the longer term order flow are in harmony.
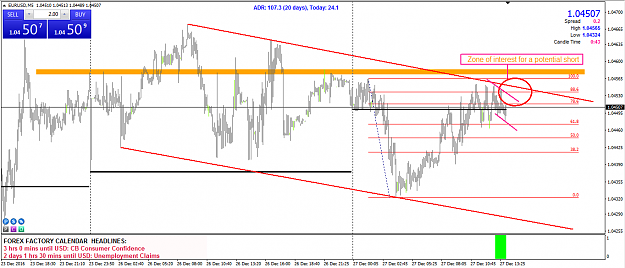
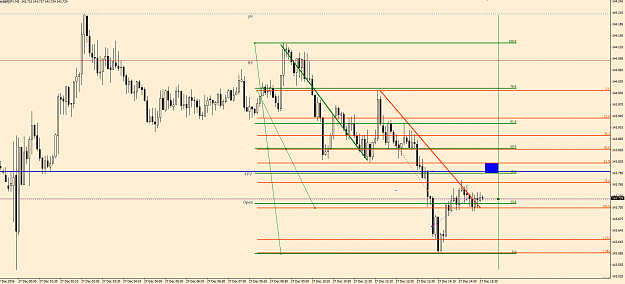
Draw in your 1 to 1 from the most recent NSL and project it upwards.
I would want to observe what PA does at the 1:1 zone in the first place followed by the 127.2 then the 161.8 however initially I would be mapping out areas of possible confluence where exhaustion Fibs meet with key chart structural levels/zones.
The bulls are showing some current strength so I would draw in my Fib exhaustion levels namely the 127.2 ext and the 161.8 ext and look for confluence with both chart structure and psch levels to start stacking the probability on my side and building a favorable case for entry.
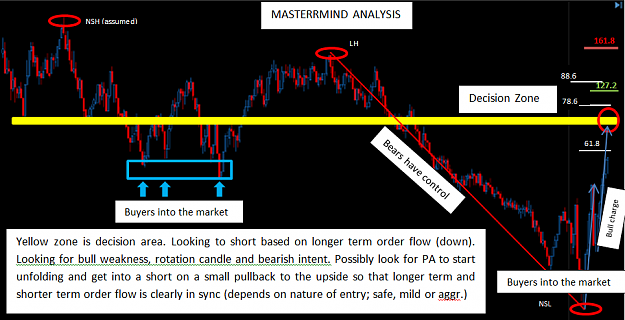
You will find that there is a key structural zone about 5-10 points above this 1 to 1 projected level heading up your chart.
I would also be looking for any confluence with Fibs from the longer term leg down which ended at the recent NSL especially looking for a zone where this 1 to 1 leg of the most recent short term order flow is likely to complete.
That is I would want to draw a longer term Fib to see what level price is likely to be pulling back too.
I would certainly not be looking to trade aggressively long ... not at all.
I would wait for price to complete this 1 to 1 (if it does) because my intention is to look for a short entry only.
I need to be very aware of where buyers and sellers have entered the market either most recently or earlier as shown on your chart.
Its important to note that to the far left side of your chart the swing lows show an important overlapping zone where buyers were happy to come into the market.
This could be important when managing your TP on a short entry because you would want to be looking to protect your trade relative to this chart structure even though on the right side of the chart these levels did not really hold ... but they have a reasonable chance of holding if the buyers show an interest at this levels ... you need to be aware of this.
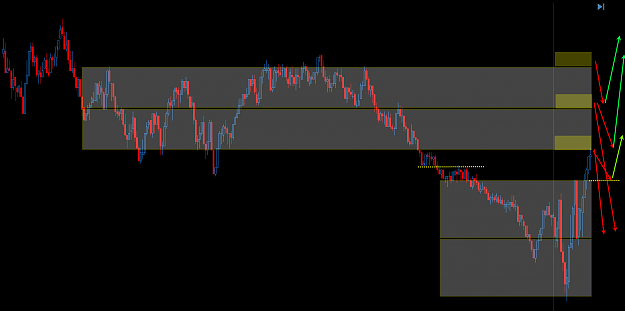
So I would not place any trades now ...
I would not trade long now....
I would wait to see what PA does heading up higher into some key chart structure.....
My expectation is for price to drive up higher by at least another 5 to 10 points before slowing down....
Based on the PA at that time I would be looking for an opportunity to short this index/pair down.....
I would not mind if price drove a bit higher up the chart because it would provide a more favorable risk to reward ratio.....
ps. I may also consider other market factors not shown by your single chart such as likely volatility caused by any market or economic news release as the case may be.
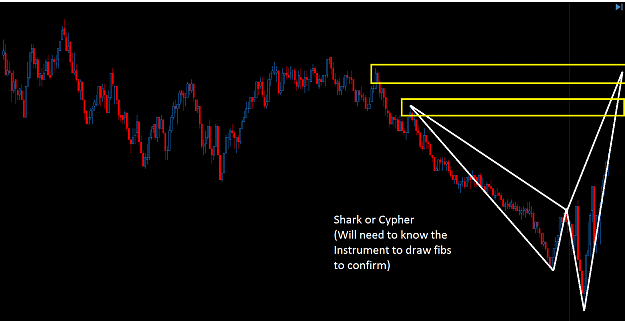
pps. If you provide the instrument I will happily complete my analysis with an annotated chart.
Masterrmind.........
Master your Mind then Master your Trades
1