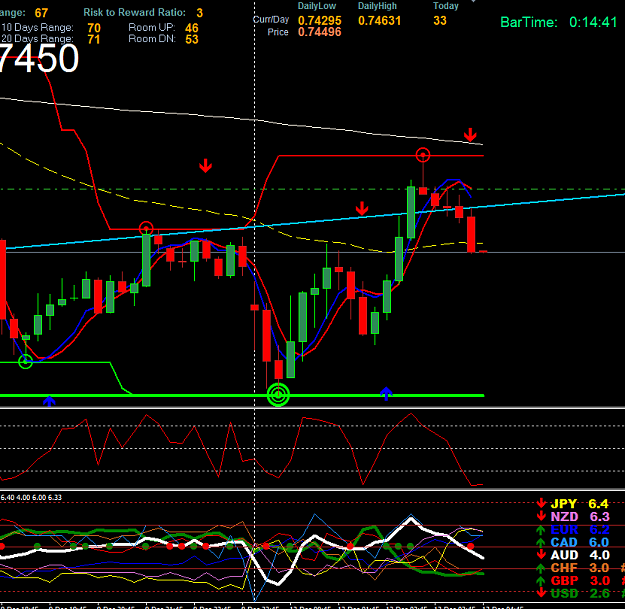
• Home
  • Forums
  • Trades
  • News
  • Calendar
  • Market
  • Brokers
  • Login
  • Join
  • User/Email: Password:
  • 10:08am
Menu
  • Forums
  • Trades
  • News
  • Calendar
  • Market
  • Brokers
  • Login
  • Join
  • 10:08am
Sister Sites
  • Metals Mine
  • Energy EXCH
  • Crypto Craft

Options

Bookmark Thread

First Page First Unread Last Page Last Post

Print Thread

Similar Threads

Jobing daily 50-100 pips 3 replies

Reality of trading system and daily 100 pips 2 replies

Honey Bunches of Pips (Easy system for newbie traders) 25 replies

Easy 45 pips strategy 2 replies

100 pip STOP for a 100 pip Target 7 replies

  • Commercial Content
  • /
  • Reply to Thread
  • Subscribe
  • 337
Attachments: 100 Pips daily target, easy to use
Exit Attachments

100 Pips daily target, easy to use

  • Last Post
  •  
  • 1 5556Page 575859 61
  • 1 56Page 5758 61
  •  
  • Post #1,121
  • Quote
  • Dec 9, 2016 12:21pm Dec 9, 2016 12:21pm
  •  Js3mwtRc
  • Joined Jun 2016 | Status: "Through Playing Down Graphs" | 2,084 Posts
Quoting ghostbiker
Disliked
what I say a long time - watch the smStrenghtRange about the move of the currencies from one pair - good is 8.0 and above against 2.0 and below = 8.0 sell 2.0 buy - example EUR is 8.2 and USD is 1.8 possible EUR go weaker USD go more strength = EURUSD sell
Ignored
New traders yet afraid to look at the strength meter, this is a tool that you need to have your eyes open and look price action from early in the morning. Also price action is important here, but this is something that they afraid to learn too. New traders don't use only indicators we share here use horizontal lines to confirm break-outs and trendlines and channels to confirm trend on big time-frames!
Feels right this time!
  • Post #1,122
  • Quote
  • Dec 9, 2016 3:25pm Dec 9, 2016 3:25pm
  •  thewriter30
  • | Joined May 2012 | Status: Worried | 458 Posts
Quoting Js3mwtRc
Disliked
{quote} New traders yet afraid to look at the strength meter, this is a tool that you need to have your eyes open and look price action from early in the morning. Also price action is important here, but this is something that they afraid to learn too. New traders don't use only indicators we share here use horizontal lines to confirm break-outs and trendlines and channels to confirm trend on big time-frames!
Ignored
 
HI GB and all
Thanks for trying to explain stuff.  it helps. I suck at trading if not I would not ask
 
So I am getting 2 messages. let me see if I understood 
 
1. Watch strength indicator in high time frames, for instance daily, so I can see overall strength right?
2. then as per ghost post if the strength is high for example 8 then this COULD mean exhaustion and the currency may reverse. ...correct? 
 
It is very hard for me to be on top of everything.  I haven't catch A SINGLE positive trade of 20 or more pips
 
If you guys REALLY  want to HELP us learn then please post or call trades from time to time before they happen explaining your logic behind the trade
 that will be really usefull
I will do this to help others once I learn to get at least 50% winners
Mix of trades Return Today: na
  • Post #1,123
  • Quote
  • Dec 9, 2016 4:40pm Dec 9, 2016 4:40pm
  •  ghostbiker
  • | Commercial Member | Joined Jul 2015 | 4,422 Posts
- the problem is the StrenghtRange is yet and in ALL TF the same in this moment

- the Strenght can change in seconds from 8 to 2 and back after news

- you can see on the strength what the price the next nearly time do

example: (you can this all watch on the "smStrengthRange" Indicator)

- the strength of EUR go 4.0 - 4.5 - 5.0 -6.0 EUR go more strength and up

- the strength of AUD go 3.5 - 3.0 -2.5 - 2.0 AUD go weaker and down so go EURAUD up sure in this time
1
  • Post #1,124
  • Quote
  • Dec 9, 2016 5:58pm Dec 9, 2016 5:58pm
  •  Freddyfx
  • Joined Jul 2007 | Status: Member | 1,201 Posts
Fraulein Ghostbiker.

Just wanting to let you know that your stuff works fine.
Do NOT get discouraged with all those complainers and trolls, lol.

Most are too lazy to read and then test a few days to get the hang of it.

Schon guten Wochenende !!!
1
  • Post #1,125
  • Quote
  • Dec 9, 2016 6:05pm Dec 9, 2016 6:05pm
  •  ghostbiker
  • | Commercial Member | Joined Jul 2015 | 4,422 Posts
thank you FreddyFX

greetings to Mexico
  • Post #1,126
  • Quote
  • Dec 10, 2016 3:37am Dec 10, 2016 3:37am
  •  Js3mwtRc
  • Joined Jun 2016 | Status: "Through Playing Down Graphs" | 2,084 Posts
Quoting thewriter30
Disliked
{quote} ÂÂ HI GB and all Thanks for trying to explain stuff. ÂÂ it helps. I suck at trading if not I would not ask ÂÂ So I am getting 2 messages. let me see if I understoodÂÂ ÂÂ 1. Watch strength indicator in high time frames, for instance daily, so I can see overall strength right? 2. then as per ghost post if the strength is high for example 8 then this COULD mean exhaustion and the currency may reverse. ...correct?ÂÂ ÂÂ It is very hard for me to be on top of everything. ÂÂ I haven't catch A SINGLE positive trade of 20 or more pips ÂÂ If...
Ignored
As for me, if the daily currency strength meter shows exhaustion (big difference between two currencies) in the opposite of the main trend then you should wait for a break of the price on the current and main trend ( the daily trend) and not the opposite. I watch this after the European market open not later. See: Elliot Wave

The best way for me to make entries is 1st) after a counter trend move is to plot horizontal lines on key support and resistance zones and 2nd) buy, or sell a retrace after a break of these zones.
Feels right this time!
1
  • Post #1,127
  • Quote
  • Dec 11, 2016 10:10am Dec 11, 2016 10:10am
  •  thewriter30
  • | Joined May 2012 | Status: Worried | 458 Posts
Quoting Js3mwtRc
Disliked
{quote} As for me, if the daily currency strength meter shows exhaustion (big difference between two currencies) in the opposite of the main trend then you should wait for a break of the price on the current and main trend ( the daily trend) and not the opposite. I watch this after the European market open not later. See: Elliot Wave The best way for me to make entries is 1st) after a counter trend move is to plot horizontal lines on key support and resistance zones and 2nd) buy, or sell a retrace after a break of these zones.
Ignored
Hi
Thanks!

Again if you could post ANY trade before it happens with you logic behind it, then that is the real deal...any thing else is just words. No offense at all, just saying people are usually Monday morning quarter backs...They all post what happened...none of them post what COULD happen.
Even if your trade then fails and touches the SL, it is helpful. It is not about pride as many idiots here post, it is about helping (if you choose to do so) others.

That is what I am doing, posting graphs etc BEFORE the trade happens. That is the right thing to do to me even when others complain about it... Because if it was easy as Freddyfx claims then we would all be rich and there would not be a FF forum now wouldn't it?

Thanks again
Mix of trades Return Today: na
  • Post #1,128
  • Quote
  • Dec 11, 2016 10:13am Dec 11, 2016 10:13am
  •  thewriter30
  • | Joined May 2012 | Status: Worried | 458 Posts
Quoting Js3mwtRc
Disliked
{quote} As for me, if the daily currency strength meter shows exhaustion (big difference between two currencies) in the opposite of the main trend then you should wait for a break of the price on the current and main trend ( the daily trend) and not the opposite.
Ignored
Trying to understand this mate. So EUR is 9, USD is 2...EUR is strong...you wait for the pair to break the CURRENT trend...say the resistance is 1.0600...
So it breaks it and it sits on 1.0620.
Then what? I understand this bit, I dont follow what you do next? You trade countertrade? you keep riding the daily trend?

cheers!
Mix of trades Return Today: na
  • Post #1,129
  • Quote
  • Dec 11, 2016 10:16am Dec 11, 2016 10:16am
  •  Freddyfx
  • Joined Jul 2007 | Status: Member | 1,201 Posts
haha, RICH ........

It all depends from which perspective!!

People in Syria would be rich if there was no war anymore, my neighbors up north don't feel rich if they don't own a second home.

ISSUE is:
learn how to read a chart, as how you learned how to ride a bike........how you learned to walk.

Watching somebody else doing it, does not mean you are capable.
While trying it yourself, you learn the hard way.

There is NO easy way.
  • Post #1,130
  • Quote
  • Edited at 11:27am Dec 11, 2016 10:35am | Edited at 11:27am
  •  ghostbiker
  • | Commercial Member | Joined Jul 2015 | 4,422 Posts
again example:

9.0 EUR and 2.0 USD = possible EURUSD sell (CounterTrend)

Description:

An interesting characteristic of single currencies on a currency strength chart is their emulation of a sine wave. All single currencies go up and down with a fairly regular rhythm. They rise to what is considered an upper bounce area, then begin lowering to the lower bounce area. Day after day.
Generally,
When a currency is rising to the number 8 strength area, it has become exhausted and will most likely begin dropping. This is not a good time to put on a buy trade. You should be ready to bail out if you are in a trade using that currency.
When a currency has dropped to the strength level 2, the movement of the currency is beginning to exhaust itself and is not a good time to sell. You should prepare to get out of the trade until it begins to bounce back up in strength again.

and here are example in pics:

http://www.accustrength.com/screenshots.html
1
  • Post #1,131
  • Quote
  • Dec 11, 2016 10:52am Dec 11, 2016 10:52am
  •  Freddyfx
  • Joined Jul 2007 | Status: Member | 1,201 Posts
I am surprised that on and on and on you find people here that have not done any homework and have NO clue what forex is all about.

They want to become the CEO with a fat salary, but did not even finish primary school, but keep whining about what and how to do the job.

My suggestion is to go do the FREE course at www.babypips.com/school and then come back and ask questions.

...and as to add to GBs explanation:
the sun goes up, the sun goes down, the waves of the ocean go up, the waves of the ocean go down
same on the charts, because if that would not happen, there would NOT be any forex.
1
  • Post #1,132
  • Quote
  • Dec 11, 2016 11:36am Dec 11, 2016 11:36am
  •  Js3mwtRc
  • Joined Jun 2016 | Status: "Through Playing Down Graphs" | 2,084 Posts
Quoting thewriter30
Disliked
{quote} Hi Thanks! Again if you could post ANY trade before it happens with you logic behind it, then that is the real deal...any thing else is just words. No offense at all, just saying people are usually Monday morning quarter backs...They all post what happened...none of them post what COULD happen. Even if your trade then fails and touches the SL, it is helpful. It is not about pride as many idiots here post, it is about helping (if you choose to do so) others. That is what I am doing, posting graphs etc BEFORE the trade happens. That is the...
Ignored


I am sorry, but when I trade I don't even open my browser to read the news I prefer to concentrate on my charts order flow and posting live trades is not easy. I don't know what all forum members do here, but I am sure that some study to make money and some are just for fun.

Quoting thewriter30
Disliked
{quote} Trying to understand this mate. So EUR is 9, USD is 2...EUR is strong...you wait for the pair to break the CURRENT trend...say the resistance is 1.0600... So it breaks it and it sits on 1.0620. Then what? I understand this bit, I dont follow what you do next? You trade countertrade? you keep riding the daily trend? cheers!
Ignored
When there is a downtrend on a daily timeframe I prefer to sell any up-move (counter-move) and the opposite when there is an uptrend.
Feels right this time!
  • Post #1,133
  • Quote
  • Dec 11, 2016 8:48pm Dec 11, 2016 8:48pm
  •  thewriter30
  • | Joined May 2012 | Status: Worried | 458 Posts
Hi all,
I am on AUD USD only, since as per GB advise and many others as well, we losers should start with one pair at a time...which I agree with.

So 2 good entries 2 bad... gain? 0%... I know geniuses avoid the bad entries...how?, i dont know.

Let's analyse this as per other advises:

1) overall direction? It is going up, in a channel, slowly but steadily. It is recovering from a long way down recently since May 2016 at 0.71...then start of November harsh leg down but couldn't break 0.7313...this tells me sell short dudes have no strength to bring it down to the previous lows (yet) ...0.71 was higher btw than the previous 0.68 so it is making for a year or more HL
2) it is Sunday here so we should be carefull with low volume
3) so it started down and made a new low M15 but higher timeframes...almost unchanged
So at this point I thought mmm this shit will go up yet again...and it did.

So my final guess is take those who are real traders would have hold the initial blue entre (it is actually a white arrow in my diagram since it was rendered too low on screen) But as per system one that blue crosses in the opposite direction as it did later (red arrow next to a cross in the diagram) I had to close the position at a loss


hope it helps other losers

cheers
Attached Image (click to enlarge)
Click to Enlarge

Name: Screenshot1.png
Size: 39 KB
Mix of trades Return Today: na
  • Post #1,134
  • Quote
  • Dec 11, 2016 9:17pm Dec 11, 2016 9:17pm
  •  Freddyfx
  • Joined Jul 2007 | Status: Member | 1,201 Posts
You are NOT a loser when you trade ONLY one pair !!!

That is MY way of trading and the broker does not catch me easily losing money.

I think it is better NOT to take any trades till London is on deck, to get an idea where this market is going.
Trades over the weekend or just upon start of the week are dangerous.

My 2 cents.
2
  • Post #1,135
  • Quote
  • Dec 11, 2016 9:47pm Dec 11, 2016 9:47pm
  •  thewriter30
  • | Joined May 2012 | Status: Worried | 458 Posts
AUD USD 15M
AUD 4.0 USD 2.6
Blue just crossed

Ignoring RED arrow sell signal. Why? because
in H1 and further it did not break the movement up from a candle pattern perspective.
The Stoch is lower than 50 as per system (below 20 actually)
I still think the movement is UP given the higher timeframes supports and upward channel
Attached Images (click to enlarge)
Click to Enlarge

Name: Screenshot1.png
Size: 66 KB Click to Enlarge

Name: Screenshot3.png
Size: 59 KB
Attached Image
Mix of trades Return Today: na
  • Post #1,136
  • Quote
  • Dec 12, 2016 10:28am Dec 12, 2016 10:28am
  •  le celte
  • Joined Jan 2012 | Status: Member | 675 Posts
Quoting ghostbiker
Disliked
and here are example in pics: http://www.accustrength.com/screenshots.html
Ignored
Bonsoir,
Very interesting link and tool !
Do you trade with this tool ?
I try it for 90 days ...

thanks
jf
  • Post #1,137
  • Quote
  • Dec 12, 2016 1:27pm Dec 12, 2016 1:27pm
  •  ghostbiker
  • | Commercial Member | Joined Jul 2015 | 4,422 Posts
the best tool ever, you become too for Smartphone or tablet included
  • Post #1,138
  • Quote
  • Dec 14, 2016 4:46pm Dec 14, 2016 4:46pm
  •  ghostbiker
  • | Commercial Member | Joined Jul 2015 | 4,422 Posts
We think that we make trade copier from middle of January as we have
received many inquiries. We will soon post closer here in this thread
  • Post #1,139
  • Quote
  • Dec 14, 2016 4:49pm Dec 14, 2016 4:49pm
  •  ghostbiker
  • | Commercial Member | Joined Jul 2015 | 4,422 Posts
We think that we make trade copier from middle of January as we have
received many inquiries. We will soon post closer here in this thread

here one of our live accounts

Attached Image (click to enlarge)
Click to Enlarge

Name: ZZ_live_12.14.JPG
Size: 55 KB
  • Post #1,140
  • Quote
  • Dec 14, 2016 8:09pm Dec 14, 2016 8:09pm
  •  daveygravy
  • | Joined May 2016 | Status: Junior Member | 5 Posts
Hi Ghostbiker, I have been using your system, and it has vastly improved my results. My only downside is exiting the trades. I think the Zerolag Stoch would help me out. Could you re post it, as I cant seem to find it on this thread. Also, the Trend Direction table doesnt show when i drag it onto the chart or the indicator list, so i am not sure if I have the correct version, so a re post would be much appreciated. Thanks for your support
  • Commercial Content
  • /
  • 100 Pips daily target, easy to use
  • Reply to Thread
    • 1 5556Page 575859 61
    • 1 56Page 5758 61
0 traders viewing now
  • More
Top of Page
  • Facebook
  • Twitter
About FF
  • Mission
  • Products
  • User Guide
  • Media Kit
  • Blog
  • Contact
FF Products
  • Forums
  • Trades
  • Calendar
  • News
  • Market
  • Brokers
  • Trade Explorer
FF Website
  • Homepage
  • Search
  • Members
  • Report a Bug
Follow FF
  • Facebook
  • Twitter

FF Sister Sites:

  • Metals Mine
  • Energy EXCH
  • Crypto Craft

Forex Factory® is a brand of Fair Economy, Inc.

Terms of Service / ©2021