Hi Rock. Here you go.
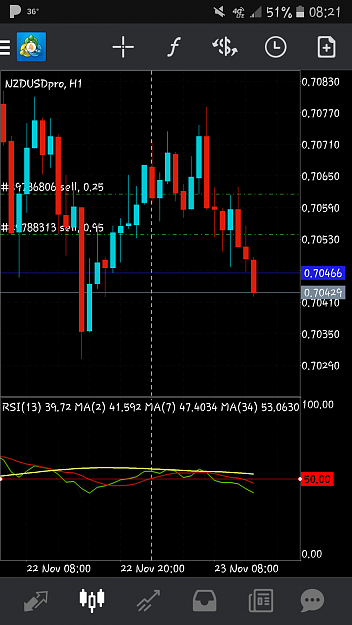
How to replicate the TDI using the standard RSI indicator.
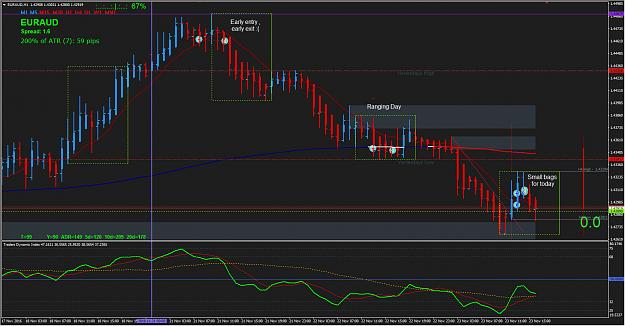
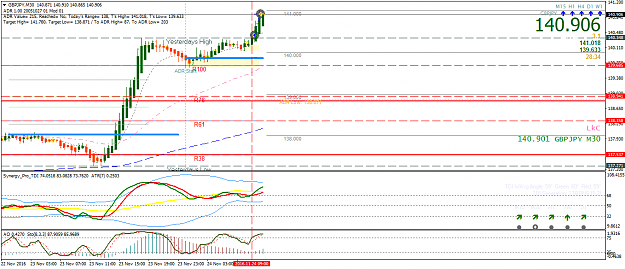
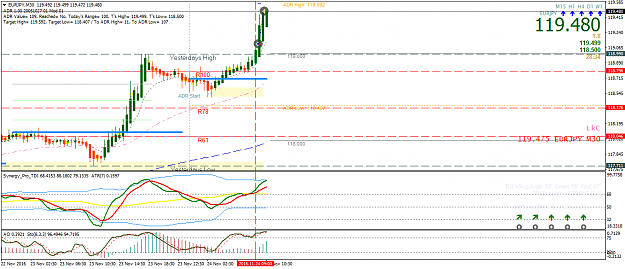
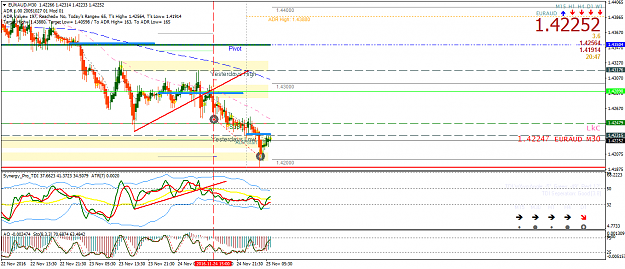
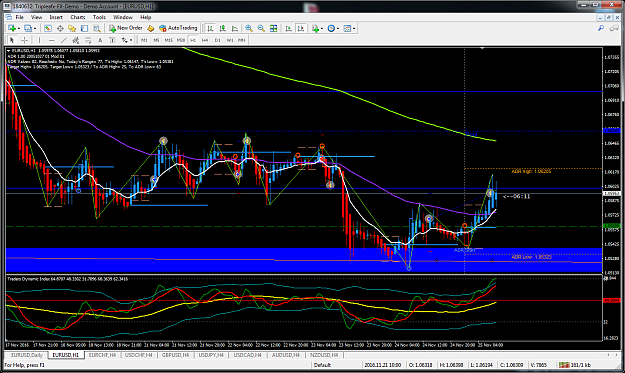
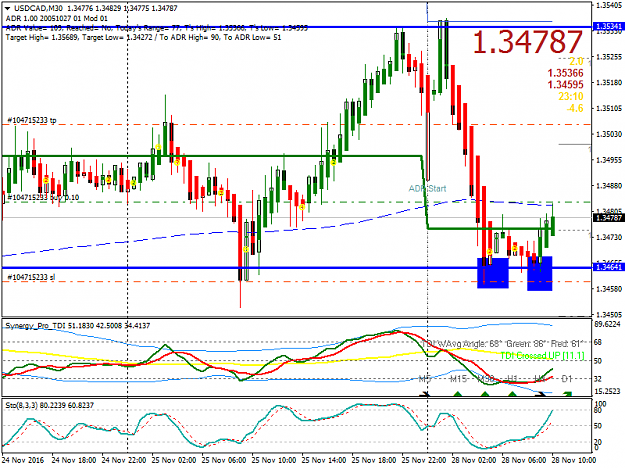
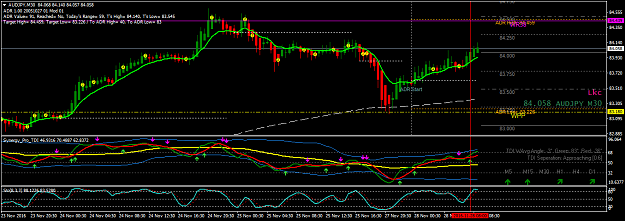
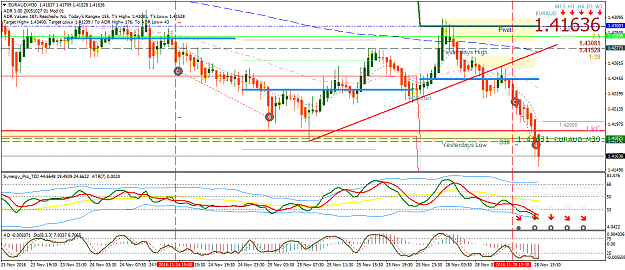
The Traders Dynamic Index aka TDI is actually 3 moving averages of the RSi data.
The default parameters are: the TDI Price Line PL green line is a SMA(2) of the RSI(period 13, Close Price). Then the TDI Trade Signal Line red line is a SMA(7) of the PL green line. The TDI Market Base Line MBL yellow line is a SMA 34 period of the PL green line.
You can replicate these using the platform standard RSI indicator:
Steps:
1. Create RSI in a new window. Set the parameters to Period 13 and use the Close Price, and set the color to None, this will not show the RSI line.
2. Select and drag the Moving Average indicator into the sub-window as the RSI. Set the MA period to 2, Simple, Close, color = Green, and the most important last parameter is to, Apply to = Previous Indicator's Data.
3. Select and drag the Moving Average indicator into the same sub-window as the RSI. Set the MA period to 7, Simple, Close, color = Red, and the most important last parameter is to, Apply to = Previous Indicator's Data.
4. Select and drag the Moving Average indicator into the same sub-window as the RSI. Set the MA period to 34, Simple, Close, color = Yellow, and the most important last parameter is to, Apply to = Previous Indicator's Data.
Note: all three settings must be Apply to = Previous Indicator's Data.
The above setup should now show the TDI replicated with these default parameters:
RSI_Period = 13
RSI_Price = 0
RSI_Price_Line = 2
RSI_Price_Type = 0
Trade_Signal_Line = 7
Trade_Signal_Type = 0
Market Base Line = 34
Market Base Line Type =0
Positive anything is better than negative thinking.- Elbert Hubbard
1
