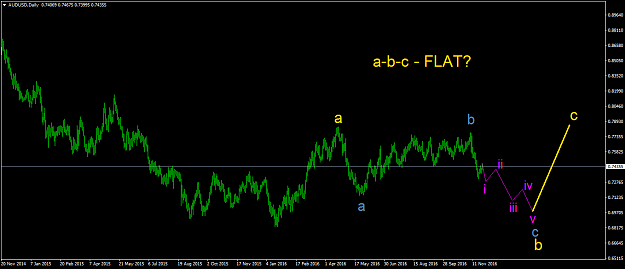
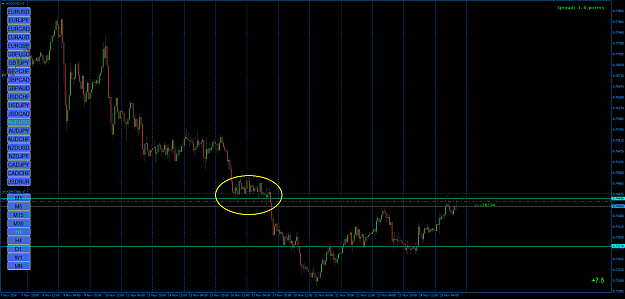
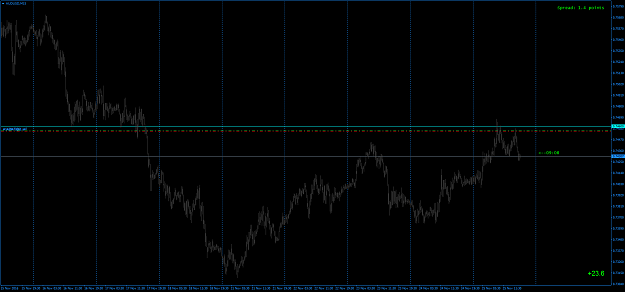
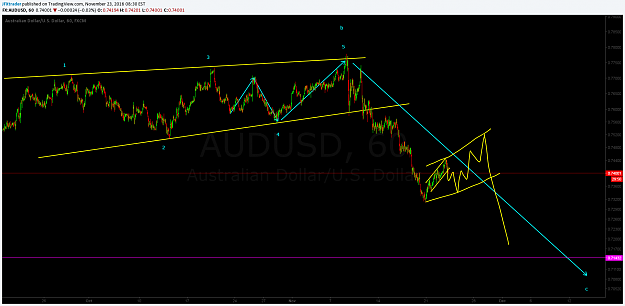
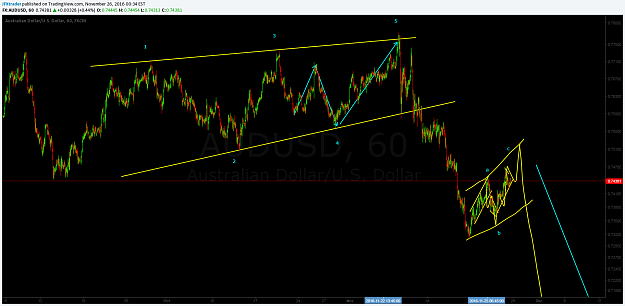
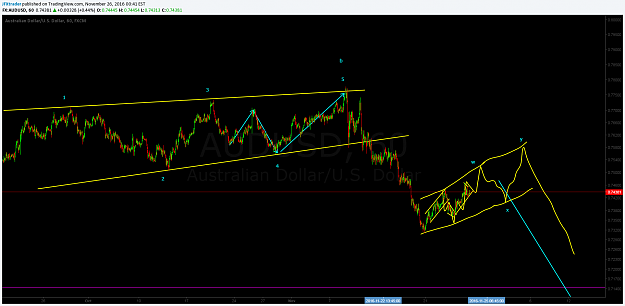
Disliked{quote} Look at post 99,766 ... In the first chart, he shows his previous prediction (blue line up, down, up to 5, then big plunge down) In the second chart, he shows how his prediction came true (and it is about half-way down the big plunge line) In the third chart, he puts a yellow line to show a consolidation up before continuing down His comment (you quote above) about going up is that consolidation. So he is still expecting it to go down and so far there has been no discrepancy. For my part, I have never seen anyone do predictions like that...Ignored
Attached Image (click to enlarge)