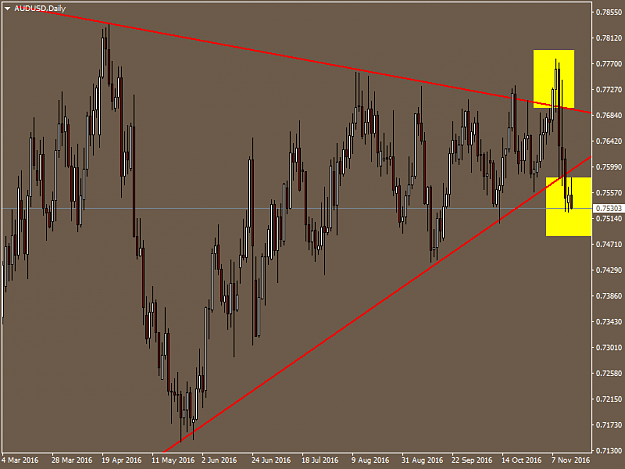
{quote} Hi there...cannot see that triangle you mentioned in the weekly chart. The weekly chart tells me maybe that the top is near, althought it is 100pips or more from this level {image}
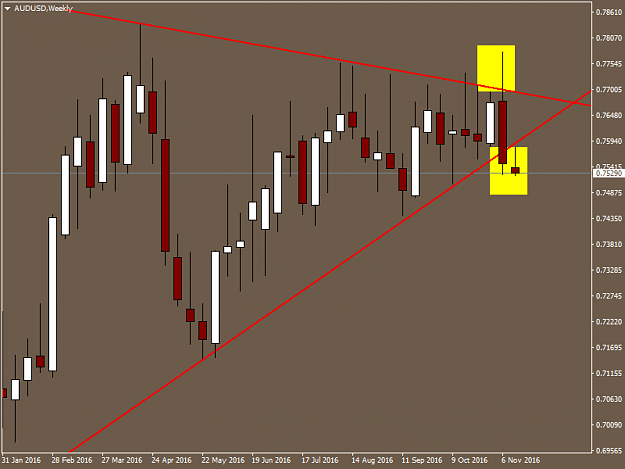
This is the daily chart. Now take a look at the weekly. When it broke out above, the weekly candles closed inside the triangle. In contrast the breakout below the triangle closed on a weekly level outside the triangle. Price actually tested the trendline again today on the hourly and retraced. It also hasn't managed to set foot inside either. That's what he means.
Very clear MSFU, the thing is sometimes the triangles seem a little manufactured if you know what i mean...as if we see what we want to see. So i wanted to see how experts or sucessful traders draw patterns
The fact that it has been compromised either way means what?
Thanks @msfu and @paulDaemon. Very clear MSFU, the thing is sometimes the triangles seem a little manufactured if you know what i mean...as if we see what we want to see. So i wanted to see how experts or sucessful traders draw patterns The fact that it has been compromised either way means what? I will read that post now thanks a lot
Ignored
I am of the opinion that it is an eventuality not a certainty. The fact that it retraced and closed inside the triangle after breaking indicates "respect" for the trendline. The fact also that it broke above during extreme volatility (US election) further reinforces the view that there was not really any serious conviction in the move but a knee jerk reaction. In contrast when the break below happened, it was steadier and more importantly price actually closed there. Regardless it is a matter of probability.
I understand....yes it is probability in the end. So now it seems to be going down...what is your signal to say let's get on board? I assume we are talking daily aud usd
{quote} Now its a wait and see This bit of data will move the market in the next hr USD Core Retail Sales m/m USD Retail Sales m/m also AUD employment later on
Ignored
Â
It moved it a lot down...
But too much??Â
I wonder if the employment data is bad and is already leaked... Alternatively - good data, so they prepare the longs... Â
So beware
Or maybe put in other words, how do you guys spot FAKE breakouts?
Ignored
You wont know it's a fake until after the move is completed...and in which case you will see that the price moves cleanly back into the original trend/zone. From my experience, the quick moves often result in a fake breakout. Versus if the market has slowly inched towards the support/resistance point before moving through steadily.
Btw all those calling for the pair to fall like a brick, isn't it a little dubious that while the usd has been rising, the AUD has remained somewhat resilient? That's quite a bit of a warning signal for bears. The 200dma has also held firmly.
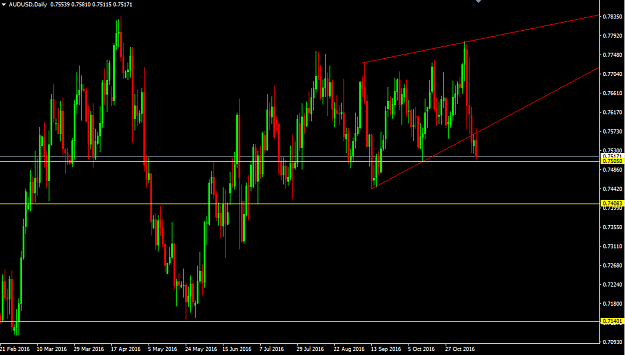
{image} @thewriter This is the daily chart. Now take a look at the weekly. When it broke out above, the weekly candles closed inside the triangle. In contrast the breakout below the triangle closed on a weekly level outside the triangle. Price actually tested the trendline again today on the hourly and retraced. It also hasn't managed to set foot inside either. That's what he means. {image}
Ignored
Â
Nice chart. Good logic.
This triangle and trendline business has been going on...Â
So break down? Just like euro a month ago....
Seems prudent to sell. Â Target as discussed below 0.68 still??
Â
Mind you, i don't trade this.
{quote} You wont know it's a fake until after the move is completed...and in which case you will see that the price moves cleanly back into the original trend/zone. From my experience, the quick moves often result in a fake breakout. Versus if the market has slowly inched towards the support/resistance point before moving through steadily. Btw all those calling for the pair to fall like a brick, isn't it a little dubious that while the usd has been rising, the AUD has remained somewhat resilient? That's quite a bit of a warning signal for bears....
Ignored
Thanks for that.
By the way, I was thinking exactly that...why isnt the AUD falling when others did...its adr pretty low
{quote} Thanks for that. By the way, I was thinking exactly that...why isnt the AUD falling when others did...its adr pretty low
Ignored
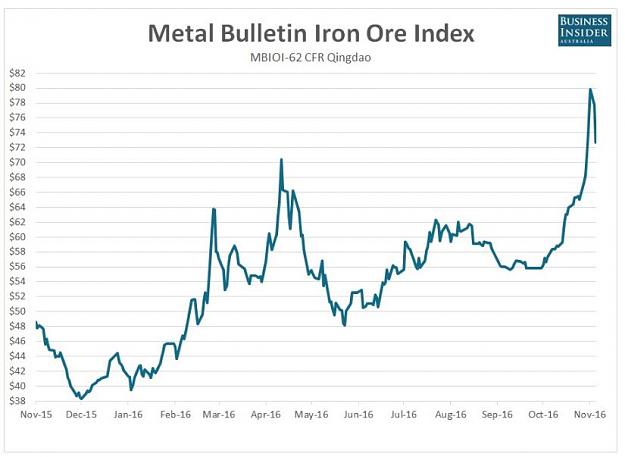
Fundamentals. Why would it crash now when iron ore, No. 1 export, is at current very profitable levels and high volume exported? LNG profits coming in from recently completed projects. Thermal and coking coal prices have made big bounce from low. I follow the charts too, and they make me cautious, so I've only been scalping small lots, but I can see no fundamental reason for a large drop in AUD from the Aussie side of the fence, only the U.S. side that shows fundamental prospects of the U.S. dollar strengthening.
{quote} Fundamentals. Why would it crash now when iron ore, No. 1 export, is at current very profitable levels and high volume exported? LNG profits coming in from recently completed projects. Thermal and coking coal prices have made big bounce from low. I follow the charts too, and they make me cautious, so I've only been scalping small lots, but I can see no fundamental reason for a large drop in AUD from the Aussie side of the fence, only the U.S. side that shows fundamental prospects of the U.S. dollar strengthening.
Ignored
Miners are hesitant about increasing supply, stocks are building on China's docks.
EDIT: if that line keeps falling, Aussie will do the same. This IS the only chart that has kept Aussie above 0.75. If it goes below $56 a ton I'd expect 0.70 aud/usd very soon after.
 is refreshing to see if am not braindead. I thought of iron ore and looked it up and couldn't believe how much it grew. but I wasnt sure that was it.
There was this bomb thrower as we call them in Argentina who was saying aussie should hot parity again and there are other bunch of analyst who believe there is another mining boom. scam I Â guessÂ
{quote}  Nice chart. Good logic. This triangle and trendline business has been going on... So break down? Just like euro a month ago.... Seems prudent to sell.  Target as discussed below 0.68 still??  Mind you, i don't trade this.
Ignored
The drop wont be overnight its will take months.
Just to clarify this with everyone.
Also to mention commodity currencies have the tendency to to take big unexpected drops of 100pips when ever they like.
We not only can rely on Aussie fundamentals for direction but also the US.
Even though Ore is stable the US economy is far batter than AUS at the moment and the USD is still classed as a safe haven currency
However fundamentals can change at any time.
Those that want to go long and think AUD will go back up to .90 go for it. I know there are a few pro analysts still think this.
If you can buy AUD at a good price and hold it for yield great, but unless you have an account of at least 100 K I really dont think its worth it.
I closed out my short positions on ausssie and kiwi after the data last night. Not enough down ward pressure now . There has been profit taking and longs added distribution/demand zone and may go up.
 is refreshing to see if am not braindead. I thought of iron ore and looked it up and couldn't believe how much it grew. but I wasnt sure that was it. There was this bomb thrower as we call them in Argentina who was saying aussie should hot parity again and there are other bunch of analyst who believe there is another mining boom. scam I  guessÂ
Ignored
Its only speculation. Here in AUS people think Trump has saved the Australian mining industry, but do you really think the states will pay top dollar for Aussie Iron when they have their own.
With decreased Chinese growth and Trumps pro American policies the Chinese economy may crash. Japanese economy has negative growth. China produces their own iron Ore and are the biggest producer in the world also. India has their own iron ore. Who will buy it from Australia?
Which side is Australia going to be on Chinas or the US. China wont like the US once Trump rips up the current trade agreements and their growth will slow.
Sorry to say unless our gov gets there act together and we stand up on our own, this economy is only going one way and that is south of heaven.
Any one have an idea why the AUD is hovering high and mighty against the JPY? I thought the AUD would of been heading south with the negative data?
Ignored
ALL currencies are significantly higher verse the Yen.
A warm and fuzzy global risk on sentiment has gripped the market since Trump was elected. Reminds me of the 2007 economic collapse in the US when the term "Irrational Exuberance" was coined.
I have pending shorts waiting @ 82.65-82.95, hope it gets that far
Pride always comes before destruction.... -Proverbs 16:18