{quote} Thanks Dude... Appreciate it. I wish it help others too.
Ignored
Well.... No questions....... I guess you all are genius guys, able to handle all by yourself.. Hope I am able to help you to get what you all want.
If you want me to post about any particular topic let me know.
{quote} I tried to confirm your first issue where (A>=B) are not equal to (A>B || A==B), but could not recreate the problem and i have never faced such type of issue in other programming language. Seems like your issue might be caused by different datatype for A and B. For your second question where you think adding few more lines is slowing down your performance significantly, then you might be using computers from 1800s...... just kidding.. Our current processing speed is much better so its not systems fault. Only in one condition it may...
Ignored
Thx, but nothing new. I move on and using new strategy. Instead using one ea to handle 10 pairs, i use separate ea that coordinate using global variables. The previus one is a mess anyway, too many arrays. I streamlined the whole process and built it from scratch, calculate when i only need it, and recycle variable and arrays. So its quite fast now. The problem is strategy tester, i run a very long period(many gigs of data) and disable the multi currency mechanism(wont work on tester unless on mt5). Anyway, i use previous generation intel xeon and yes it slow. I ll bought a new one next year maybe.
And i dont always process tick data, mostly only on new bar albeit on several tf.
{quote} Thx, but nothing new. I move on and using new strategy. Instead using one ea to handle 10 pairs, i use separate ea that coordinate using global variables. The previus one is a mess anyway, too many arrays. I streamlined the whole process and built it from scratch, calculate when i only need it, and recycle variable and arrays. So its quite fast now. The problem is strategy tester, i run a very long period(many gigs of data) and disable the multi currency mechanism(wont work on tester unless on mt5). Anyway, i use previous generation intel...
Ignored
Ohh... I get it. Using global variable to coordinate EA working on separate currency pair is a very good method to keep a birds-eye view over the whole market. If your laptop is slow why not move into any VPS services like amazon or google. Both provide free service for 1 year or 6 months respectively. Or contact your broker customer service, sometime they also provide good VPS setup which can be free if the account balance is more then their set value.
Sorry guys... I was busy learning new things.... so I was not able to post anything.... don't worry... next post will come soon.
Ignored
Hi Ds
Thank you for starting the thread, please help edit the attached pivot indicator codes below to ensure that it move from period to period ( so that I can see historical pivot points) e.g day to day, week to week and month to month. What it does now is just draws a straight line showing the pivot. Thank you
{quote} Hi Ds Thank you for starting the thread, please help edit the attached pivot indicator codes below to ensure that it move from period to period ( so that I can see historical pivot points) e.g day to day, week to week and month to month. What it does now is just draws a straight line showing the pivot. Thank you {file}
Ignored
With my busy schedule, I can't promise to help you completely..... but put up your doubts referring your code positions... of if you are stuck with any logic post it... I will try to answer as many as possible.
{quote} With my busy schedule, I can't promise to help you completely..... but put up your doubts referring your code positions... of if you are stuck with any logic post it... I will try to answer as many as possible.
Ignored
The logic I want is the code to add to ensure the pivot point move with period allowing to see historical pivot points, just as highlighted in my request.
Thank you
D labour of a fool wearieth him cos he doesn't know how to enta d city
{quote} The logic I want is the code to add to ensure the pivot point move with period allowing to see historical pivot points, just as highlighted in my request. Thank you
Ignored
Ok.... Let me have a look at the code.. I will update
Hia D.s I was thinking, yeah What about having a expert that can write to and read from say 3 separate spreadsheets, one would probably be enough but just in case.
Ignored
Writing into text files is not difficult. But if you are interested with spreadsheet in particular, i think that will posses some issue.
{quote} Hi Ds Thank you for starting the thread, please help edit the attached pivot indicator codes below to ensure that it move from period to period ( so that I can see historical pivot points) e.g day to day, week to week and month to month. What it does now is just draws a straight line showing the pivot. Thank you {file}
Ignored
I went through the code and i find it displays the pivot point within the provided start and end candle of H1 time frame. I am still not getting exactly what you want to be displayed. What i think that you want pivot points to be drawn for a fixed week or month or day as per your wish so Instead of keeping H1 time frame, why don't you accept time frame and no of candles (period) as input which can be used to generate candles with that time frame. Then you can calculate highest and lowest point from 7 or 24 or 30 candles as per your need.
This way you can specify the exact period of your candles you need to calculate. It will be better if you could take a snapshot of your screen and manually draw lines on them using paint, and post it here so that we will be more clear about your requirement.
{quote} I went through the code and i find it displays the pivot point within the provided start and end candle of H1 time frame. I am still not getting exactly what you want to be displayed. What i think that you want pivot points to be drawn for a fixed week or month or day as per your wish so Instead of keeping H1 time frame, why don't you accept time frame and no of candles (period) as input which can be used to generate candles with that time frame. Then you can calculate highest and lowest point from 7 or 24 or 30 candles as per your need....
Ignored
Many thanks for yourresponse, I appreciate.
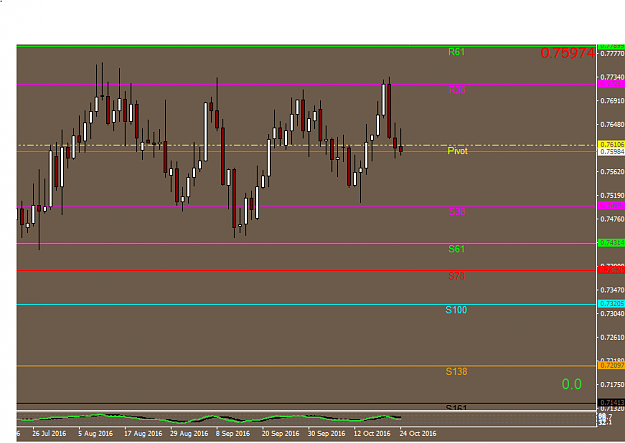
This is how the indicator shows now;
Attached Image (click to enlarge)
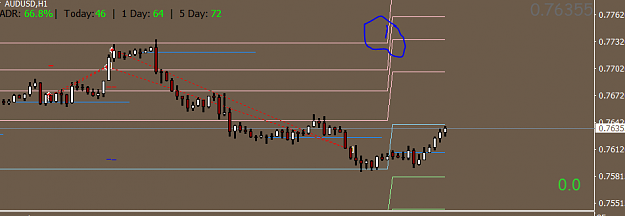
Below is what I want to show with the fibo levels label;
Attached Image (click to enlarge)
D labour of a fool wearieth him cos he doesn't know how to enta d city
Hi, D.S
This is a great thread indeed, thumbs up for you on this
I got some question regarding coding here.
If like say I want to have the exe file of an EA to be converted back to mql source code file,
is there a way to do it?
Hi, D.S This is a great thread indeed, thumbs up for you on this I got some question regarding coding here. If like say I want to have the exe file of an EA to be converted back to mql source code file, is there a way to do it? Hope to hear from you soon. Regards
Ignored
Dude... thats like illegal work. Its called de-compiling. There are tools available to create the original source code, but the variable names will change, all the comments will be gone.... so its not completely understandable until you are a expert coder.
To make it simple. Its just NO. Do not try that. Its wastage of time and resource, until the code is something awsome