{quote} Luckily it happened as I thought, although I quit the market b4 London open Bcuz of the weak hands as u say
Ignored
When a market is in such conditions of weakness you have to be very prudent. Maybe this time you didn't make profits but at least knowing the partecipants involved in and ruling a market like this a trader could skip some loss attempting here and there initially. Anyhow the important thing is to be consistent in the profits on the long run: stay with the odds and you could make it.
15:43 Very important note: up to yesterday pit session low 22185 we have a double pass gap (2201-22185). Upside from 10.17 session and downside from yesterday.
This market goes from weakness to weakness: preUS poor low and current A period at preUS half back. Above countless weaknesses. Also note price up and down open...
16:01 also pit session poor low, B period high at half back. This is fantastic.
Also a poor high... Sorry guys but I'm off. I will not trade such an environment. If it will continue in this way I think we got a serious problem with cable.
Have a good continuation and let's see next week. Best L.
Also a poor high... Sorry guys but I'm off. I will not trade such an environment. If it will continue in this way I think we got a serious problem with cable. Have a good continuation and let's see next week. Best L.
Ignored
You deserved a !
Have a good weekend!!
You can manage risk, but you can't manage the return
16 10 21 Friday 08:57 EARLY MORNING REPORT First of all let me say that current situation is very rare. We have all the last sessions with poor highs starting from Wednsday pit session 23222, continuing with Tokyo 22974, GB 2286 and pit session 2274 from yesterday. Then also today Sydney 22595. The only one without a poor high is current Tokyo that anyway is tagging Sydney high making it even more weak.
Only a stronghold made by a big gap downside from yesterday GB low (22504)could avoid a correction in a normal condition:but is current situation normal?, is the question.
Ignored
The abnormal weakness left above has been eventually skipped only for the presence of a big GB gap downside from 22504, as written: GB attempted a retracement but didn't manage to close it. When it eventually failed the very weak action downside continued lower.
09:18 +1GMT GB opened with a small gap and start to go down from it. Will this little gap be enough to skip the mess upside? I really do not know the correct answer. The only thing I know is that if it will continue downside, below we got the composite poc at 2193 and the very weak zone at 2135.
Let's see what this very strange and extremely weak market is going to do:note that GB value from yesterday was below the GB value of the day before as today current GB value is developing below that of yesterday.
Ignored
The remaining portion of the big gap downside worked effectively as a resistence upside and let this action continue lower: during preUS price menaged to reach the composite POC at 2193 but, considering the weakness left above was not strong enough to continue lower than that. (2135 cluster of lows not reached). I also note the direction of the developing value and I underlined that current value was developing below in a one timeframing mode.
A low tagged exactly the top of the GB gap upside at 22294 (GB low from 10.17)I do not like at all this market what ever it si going to do.I suggest to be very prudent because in my experience this is an extremely rare environment. 09:29 +1GMT If we retrace the little gap and we find acceptation above it we could eventually retrace the weaknesses above.
But watch out because curent low is weak as it is a tag a of a previous GB low.
Ignored
Again I felt the urgency to repeat the warning about current weakness: at that moment in time it could go lower or retrace but in any case the underneath weakness could leave a trader in the middle of a dangerous situation without strong structural places to place a stop.
{quote} Any move that use exact references as starting point is a weak move for definition. At least initially. Because the only people who know and use such refs to trade are weak hands. Stronger hands didn't know them nor they could care less about them. Slightly bigger timeframes could eventually act against them when they find weakest hands piling on very weak move like current one.
Ignored
During price action downside, answering to a fellow trader's question, I explained the reasons that let me identify this move as weak.
EXAMPLE: we have a mess of weak levels above, anyone of them made by an exact reference: where do you think are the weakest hands and where do you think are the slightly stronger hands right now?
Weakest hands are clearly above, slightly stronger could be nowhere or waiting downside some where. If they are nowhere (not present in current market) a very weak move like this could continue anyhow. But if they are somewhere downside waiting when we finally find them we will have a correction upside and a punishment for all those weak guys piling on this move.
So in this case I do nothing and wait. Maybe I'm going to lose a big move downside but at least I'm not working against odds. And on the long run this is the only way to survive in markets.
Ignored
Here I repeat the previous expressed concept about the weakness of this move downside but I also warned about the possibility of a continuation lower if no buyers will be found downside: but if these slightly stronger buyers will be eventually found, a retracement upside will not have any meaningfull resistence to oppose. I also added a personal note about my behavior and my attitude to risk.
11:59 This correction stalled exactly at current half back 2234: this provide us 2 usefull information. It is still weak going downside because we still have weak partecipants selling from exact references. It is a weak reaction upwards because stronger timeframes will never be stopped by weak hands at half back.
Ignored
Even if the move downward continued to be very weak, the first reaction found downside looked to me very weak too: I explained the reasons of my conlusion.
12:44 Now G period is inside bar of F. Again: everything is weak above and below. The weak momentum is still down and for now I see no buyers at all. Very dangerous situation to trade. We have a double TAG at half back and if it will continue lower form here it will put itself in big troubles I think.
Ignored
We are only 15 minutes before the final spike downside made by GB. We are in the H period that made its high at 22295: I warned about the fact that the market is already weak and that if eventually it will continue lower from here it will put itself in a very risky situation: at the end of the day all the GB action downside will be retraced up to 2 pips below open at 2243 and well above the H period high at 22295 when I made this statement.
13:27 The weak break downside left a minus development in H period up to 22215: if removed there are odds for a correction upside, if preserved we could see price continue lower.
Ignored
This minus development was not retraced by last period of GB (J): after the failed retracement, price action continued lower.
15:32 +1GMT Pit session opens with a gap downside, if preserved we could insist downwards. If retraced quickly, you know where it could go.Note the preUS poor low.
Ignored
The pit session gap has been retraced in the first 3 periods of the session and in fact price continue higher from that untill the end of the session. But at the same time I also made a note about the presence of a preUS poor low: it was clearly a warningabout the weakness of the buying reaction. Stronger timeframes do not start a counter action leaving downside a poor low. As a consequence of this weakness left below, just after the correction of the pit GAP downside, C period retraced itself closing downside only some pips above pit open at 21907. (an other weak reference anyhow)
{quote} When a market is in such conditions of weakness you have to be very prudent. Maybe this time you didn't make profits but at least knowing the partecipants involved in and ruling a market like this a trader could skip some loss attempting here and there initially. Anyhow the important thing is to be consistent in the profits on the long run: stay with the odds and you could make it.
Ignored
A fallow trader wrote that as a consequence of my initial advices about the underneath weakness of the move downside, he opted to step aside and do not follow the price action. About this I must say that I do not take any responsability for other decisions: I write what I consider correct form my point of view, considering my attitude to risk and my experience. Other traders are free to use my considerations in the best way they could but in any case they have to feel themselves free to take decision indipendently and always in the condition to not follow me acritically.
As Dalton wrote in one of his available articles: "Successful trading requires that you protect yourself from your own opinions, my opinions, if you are reading our blog, the news services, and anyone else that you may be following. The answer rests in employing market‐generated information (MGI): listening to the market versus those referred to above. Quite often we get an opinion riveted into our mind only to see the market doing something entirely different; if you have advanced to the stage of understanding and endorsing MGI yet are unable to act when you clearly see a different opinion expressed by the MGI, you are experiencing cognitive dissonance, the psychological conflict resulting from holding two simultaneous, conflicting thoughts. I never knew a trader who hasnt constantly had to deal with this issue; the emphasis is ongoing."
15:43 Very important note: up to yesterday pit session low 22185 we have a double pass gap (2201-22185). Upside from 10.17 session and downside from yesterday.
Ignored
In a normal situation a gap downside is a form of resistence as written many time. And if it is a double pass gap it could be even stronger than usual leading eventually to an island reversal: but in a market full of weaknesses above as it was Friday a double pass gap downside could instead aggravate the situation becoming a further suspect zone that could lead buyers to a reaction in order to verify and fill it. This is exactly what happened in the next 3 periods.
This market goes from weakness to weakness: preUS poor low and current A period at preUS half back. Above countless weaknesses. Also note price up and down open... 16:01 also pit session poor low, B period high at half back. This is fantastic.
Also a poor high... Sorry guys but I'm off. I will not trade such an environment. If it will continue in this way I think we got a serious problem with cable. Have a good continuation and let's see next week. Best L.
Ignored
When I saw price going up and down open price, leaving below the preUS poor low and adding to it also a new poor low for current session I understood that the situation became exceptionally risky. When I eventually saw also a poor high for pit session, I decided to step aside: it was a personal decision obviously and an other trader with a different attitude to risk could opt to try something above or below. It is absolutely licit and needed to take personal decisions, the only thing that this procedure requires always is to be conscious of the risks involved in it.
This commentary will follow a top down perspective.
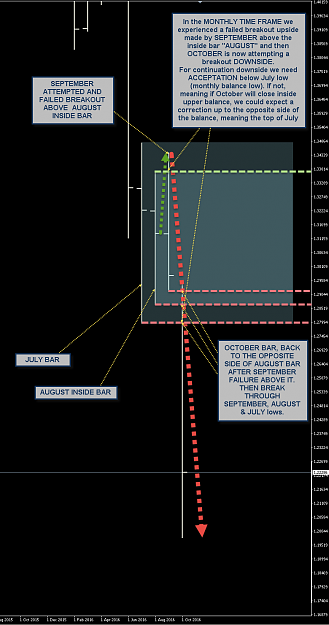
Monthly As you could see observing the monthly chart we currently are in an attempted breakout from balance. We experienced a failed breakout upside made by September above the inside "bar" August and then October complete the work of September coming down to the opposite side of the balance and eventually attempting a breakout downwards. For continuation downside we need acceptation below July low (monthly balance low). If not, meaning if October will close inside upper balance, we could expect a correction up to the opposite side of the balance, meaning the top of July.
Attached Image (click to enlarge)
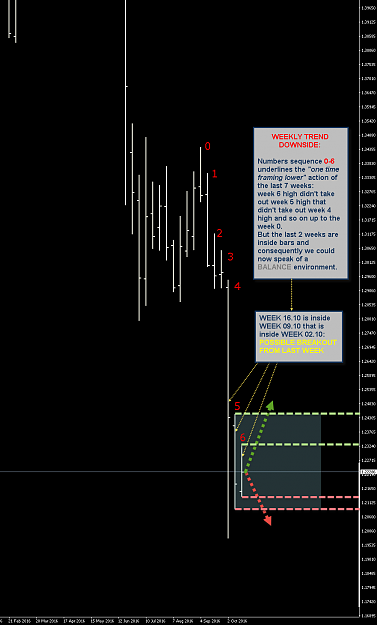
Weekly In the weekly chart it is easily to see the current mid term trend downside. The number sequence 0 to 6 in the chart underlines the "one time framing lower" action of the last 7 weeks: week 6 high didn't take out week 5 high that didn't take out week 4 high and so on up to the week 0. But the last 2 weeks are inside bars and consequently we could now speak of a balance environment. In fact week 16.10 is inside bar of week 09.10 that is inside bar of week 02.10. Current balance situation, as also other traders properly underlined, could lead to a possible breakout. The first test for this has to be above or below last week range (21353-23317).
Attached Image (click to enlarge)
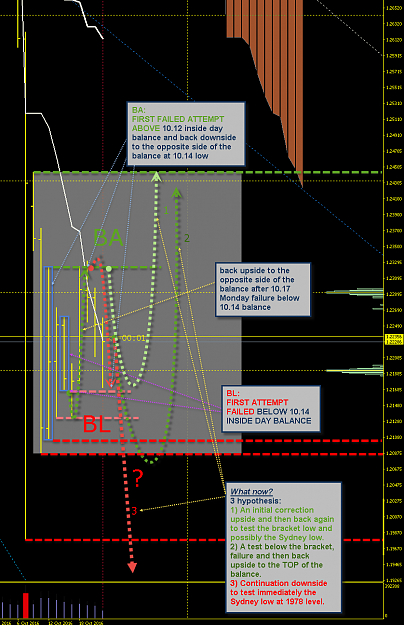
Daily The daily chart is more complex and it seems to reflect the indecision and the lack of partecipation of bigger timeframes** in current market. We had an initial balance made by 10.12-13-14 days. Then 10.17 (last Monday) attempted a breakout downside, failing it and as direct consequence of this failure, 10.18 (Tuesday) rallied up to the opposite side of the balance where 10.19 (Wednsday) attempted a new breakout, this time upwards, failing again. The consequence of this further failure above balance was, again, the retracement back down to its opposite side made by Wednsday, Thursday and eventually Friday. "What now?" is the natural answer. I made three hypothesis:
An initial correction upside and then back again to test the bracket low and possibly the "all time" Sydney low.
A test below the bracket, a failure and then back upside to the TOP of the balance.
A continuation downside to test immediately the Sydney low at 1978 level.
**just to quickly summarize the timeframes that could be involved in any possible market let me report here a list (used by JD):
Scalpers: minor intraday timeframes.
Day traders: flat at the end of the day.
Short term traders: positions lasting 5 to 10 days.
Intermediate term traders: positions lasting week or months.
Long term investors: positions lasting months or even years.
Of this list when I'm referring to bigger timeframes I'm speaking about Short term, Intermediate and Long term traders.
Attached Image (click to enlarge)
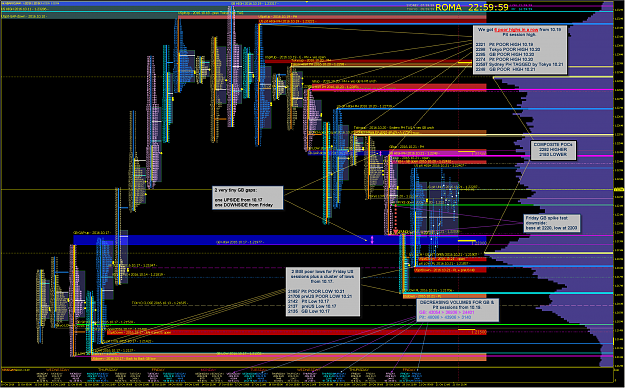
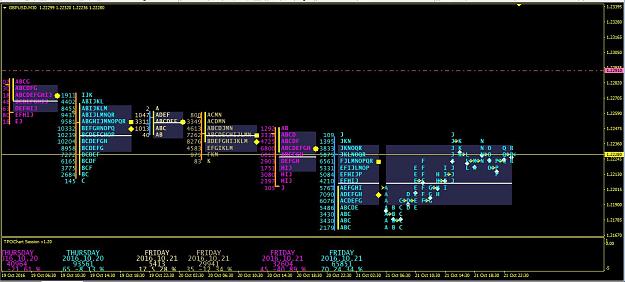
Sessions If we make a step forward, analyzing the session profiles of the last days starting from Sunday 10.16 (in the chart it is Sydney session 10.17) we clearly visualize what we were writing about the lack of partecipation in the daily timeframe. As you see we got an incredible and very rare sequence of weak references above and below current price position (Friday 10.21 unchanged at 22287). Above price left something like 6 poor highs in a row ( GB 10.21 at 2248, Sydney 10.20 at 22597, Pit 10.20 at 2274, GB 10.20 at 2285, Tokyo 10.20 at 2298 and finally Pit 10.19 at 2322) while below Friday ended leaving behind 2 back to back poor lows made by pit session at 21706 and preUS session at 21857. Downside we also have a very suspect cluster of lows at 2135 zone (Pit 10.17 at 2142, preUS 10.17 at 2137, GB 10.17 at 2135 and GB 10.13* at 2132.) *GB 10.13 is not visualized in the chart attached.
Now, having said that, let's analyze more in depth how this situation developed.
After the big liquidation made by 10.11 Pit session (226 pips downside) Sidney cover the inventories became too short up to 10.12 Tokyo high at 2325. From there Tokyo 10.12 itself started a new liquidation of the inventories built by Sydney now too long: this liquidation ended with the Thursday GB 10.13 low at 2132 (the base of the current bracket.) From there we saw a new short covering and a following liquidation ended with last week GB Monday low at 2135, just 3 pips above the bracket low made the week before.
A first consideration is about the lasting time of this up and down swing: one or 2 day as a maximum, meaning the absence of any timeframe higher than the daily one. Only daily timefremes and scalpers present in such environment.
After the weak low established on Monday 10.17 (it is weak because it took place too close too a previous low) we saw a new short covering up to the GB 10.19 (Wednsday) at 23317: note also in this case that this high is only 3 pips above the preUS high at 23286 made during the 10.11 big US liquidation. So it is evident that also in this case the top has not seen the partecipation of stronger timeframes that do not use exact references to act.
Now from there we saw the incredible weak liquidation that made 6 poor highs in a row, described previously. It is important to say that the poor highs are not the only signals underlining the weakness of this move downside: coming downwards price continuosly stalled at exact references. With this we have a confirmation of the fact that those who were leading this action were weak because if they were stronger they never stopped for pauses at exact weak references.
Eventually Friday GB session opened with a gap downside from 10.20 GB session low and after a very uncertain session it made a final attempt downside with a test spike (the last 2 periods of GB session) starting from 2220 (spike base). The folowing US sessions (preUS and Pit) simply covered the inventories too short left by the GB weak action downside.
Note that while GB and US sessions went down building value lower session after session, their respective volumes progressively decreased: GB from 10.19 43054 to 10.21 24401 (almost the half of the starting volume upside), US Pit from 10.19 48086 to 10.21 31400. So for this reason we could say we have conflicting information.
A conclusion.
A spike is a form of benchmark. Traders tend to attempt a direction in order to observe the reaction of other market partecipants. The GB spike from Friday is consequently a very important test downside and we need to verify the reaction of upcoming GB sessions in order to evaluate the success or failure of that attempt. If GB will open below the spike or at the bottom of it we could read this as an initial acceptation of that attempt. If above its base (2220) or just some pips below it that test could be considered rejected at least initially and we could expect a correction upside.
In any case, even if price will accept that test continuing lower, I will not consider what we left above as a good start point for a significant move downside. The weaknesses left above are eccessive even in the possible presence of a gap dowside. So watch out if price continue lower because a possible reaction could be seen just after the correction of the cluster of lows at the 2135 zone.
If instead price will open above the spike base (2220) the odds are clearly in favour of a correction, at least partial, of the weaknesses left above. But also in this case, only removing the poor lows at 21706 and 21857 we could imagine something significant upside.
A very final note is about the 2 GB tiny gaps we still have to correct, one, above is less than 3 pips (2248-22504) the other one, dowside, is less than 6 pips (21977-22038): similar gaps generally are not left behind major price actions, so take them in serious consideration during upcoming GB session.
PS: the main composite POCs are at 2193 below and 2292 above: these are clearly important references because in a weak rotational environment leaded by weak hands, the POCs work as nodes of attraction for price.
Hi LOCK,
I really appreciate the work your doing and sharing it's really great work. I hope you keep going with it.
One thing though, what I have on my screen is not what you have just posted on yours. I have read the entire thread a couple of times and found some instructions that have been very helpful.
Any help (from anyone) with the settings so days are not split in segments is very much appreciated. Thanks.
Hi LOCK, I really appreciate the work your doing and sharing it's really great work. I hope you keep going with it. One thing though, what I have on my screen is not what you have just posted on yours. I have read the entire thread a couple of times and found some instructions that have been very helpful. Any help (from anyone) with the settings so days are not split in segments is very much appreciated. Thanks. {image}
Ignored
Hello Zaak, thank you for your compliements. My session chart is very similar to yours but: different RowHeight (bigger than 1) and you set EnableMergeProfile to true and MergeProfile to F (meaning merge preUs+Pit US and let the other sessions separate). The segments you are speaking about are maybe the splitted periods of the last Pit session? If so to remove them you have to set ShowSplitProfileSes to false.* Note anyhow that in my chart the periods are splitted too so maybe I did not understend what you mean. Furthermore I suggest to let them split in order to better understand the developing of the current session profile. If instead you are referring to the splitted sessions, in order to have one single profile for each day, simply let everything has now but choose letter "E" on the MergeProfile field. I hope it could help you. Best L.
* BTW if I noticed a mistake in the code doing so because the value area of the last profile results stretched to the left side of the chart. I will correct this asap.
07:40 +GMT Today Sydney high at 2226 is the seventh poor high in a row from 10.19 2322 pit high: carry this info forward.
07:45 We are now at the bottom of the Friday GB session low, inside its spike (base at 2220): remember the spike rules when GB will open at 9:00.
08:22 +1GMT L and M Tokyo periods both tagged round 2200. It's weak. Carry this info forward. For now consider that the market is still ruled by weak hands. The problem here is that above we have huge weaknesses. Let's see what will happen before GB open.
08:26 Also note that Tokyo low is just 1 single pip below Friday pit session poor low at 21856. So whatever you will see upside, even big it will with any probability a short covering. A SC that anyone is waiting but who knows...
08:32 Note price action up and down GB close from Friday at 22084.
08:45 Both M and N Tokyo periods tag Tokyo open above at 22173. Very weak market.
09:28 this is a short covering: if it works we will see a correction above up to 2285 at least. If not back to the composite poc below at 2192. We need acceptation above Tokyo high for any meaningfull continuation upside: note that we have big weaknesses below. So remember: if it will continue it will short covering and nothing more, at least initially.