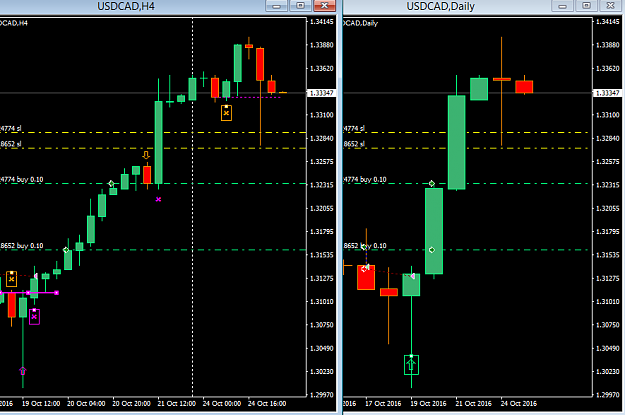
• Home
  • Forums
  • Trades
  • News
  • Calendar
  • Market
  • Brokers
  • Login
  • Join
  • User/Email: Password:
  • 4:28am
Menu
  • Forums
  • Trades
  • News
  • Calendar
  • Market
  • Brokers
  • Login
  • Join
  • 4:28am
Sister Sites
  • Metals Mine
  • Energy EXCH
  • Crypto Craft

Options

Bookmark Thread

First Page First Unread Last Page Last Post

Print Thread

Similar Threads

Difference between buy/sell stops & buy/sell limits 34 replies

Difference between buy limit, sell limit, buy stop, & sell stop? 4 replies

how to change buy to sell, sell to buy for EA 1 reply

the buy/buy or sell/sell currency broker?? 5 replies

I am looking for EA to put Buy Stops, Buy limits, Sell limits, and Sell Stops. I will 0 replies

  • Trading Discussion
  • /
  • Reply to Thread
  • Subscribe
  • 582
Attachments: When Price is UP, buy; when Price is Down, sell short...
Exit Attachments
Tags: When Price is UP, buy; when Price is Down, sell short...
Cancel

When Price is UP, buy; when Price is Down, sell short...

  • Last Post
  •  
  • 1 525354Page 5556 57
  • 1 54Page 5556 57
  •  
  • Post #1,081
  • Quote
  • Oct 9, 2016 3:43pm Oct 9, 2016 3:43pm
  •  Fadhl
  • Joined Jan 2016 | Status: Member | 938 Posts
Quoting sunshine
Disliked
{quote} you're welcome Fadhl, and yes, USDCAD gave Wkly continuation signal bar and the 4hrs entry chart produced a buy entry. do not be concerned about Oil, there is no rule that the Loonie and Oil should move opposite.
Ignored
Thanks so much!
 
 
  • Post #1,082
  • Quote
  • Oct 10, 2016 1:08am Oct 10, 2016 1:08am
  •  sunshine
  • Joined Mar 2007 | Status: Member | 1,190 Posts
Quoting Fadhl
Disliked
{quote} Thanks so much!
Ignored
u welcome..

i see that you are in a trade that's underwater... i would suggest to forget about... write it off in your mind as a loss. do not watch it.. leave be.
then at the end of the week, take a look at it again, always keeping in mind that now u are a Swing Trader, whether by choice or forced by circumstances.
 
 
  • Post #1,083
  • Quote
  • Oct 17, 2016 9:14am Oct 17, 2016 9:14am
  •  compro99
  • | Joined Aug 2004 | Status: Member | 481 Posts
Clarify my doubt,

Bias is based on last weekly/monthly candle UP/DOWN or break of last HIGH/LOW ?
The future depends on what we do in the present.
 
 
  • Post #1,084
  • Quote
  • Oct 19, 2016 2:52pm Oct 19, 2016 2:52pm
  •  Trade.Time
  • | Joined Apr 2014 | Status: Member | 48 Posts
Hi compro99,
The method of this thread is quite simple but I to had trouble understanding it clearly.
I suggest you give the last 10 pages a good read.
After that I found it beneficial to write it out in my own words as below:-

When Price is Up Buy; When Price is Down Sell - The Basics!

1/- Monthly/Daily combination for Monthly Uptrend:
The trend is determined by last month's bar.
Check the Monthly Chart.

  1. If the last monthly bar close is up (a bullish candle), the trend is up.


On the daily chart, the daily bias is determined by the relationship the last 2 closes have to each other. Check the last closing price on the Daily Chart.

  1. If it’s above the close of the last daily swing high, the daily bias is up.
  2. When the monthly trend is up & the daily bias is up just buy bullish reversal bar signals.
  3. If it’s below the close of the last daily swing low, the daily bias is down
  4. When the monthly trend is up & the daily bias is down sell bearish reversal bar signals & buy bullish reversal bar signals.


2/- Monthly/Daily combination for Monthly Downtrend:
The trend is determined by last month's bar.
Check the Monthly Chart.

  1. If the last monthly bar close is down (a bearish candle), the trend is down.


On the daily chart, the daily bias is determined by the relationship the last 2 closes have to each other. Check the last closing price on the Daily Chart.

  1. If it’s below the close of the last daily swing low, the daily bias is down
  2. When the monthly trend is down & the daily bias is down just sell bearish reversal bar signals.
  3. If it’s above the close of the last daily swing high, the daily bias is up.
  4. When the monthly trend is down & the daily bias is up, buy bullish reversal signals & sell bearish reversal bar signals.


3/- Weekly/4hour combination

  1. Same as above using weekly & 4 hourly charts.


4/- Exits:

  1. Trades with the trend have a better chance of going further than a counter trend trade, but to be safe make the take profit amount the same as the stop loss amount.
  2. With a counter trend trade, it's often best to exit at the next bar.


  • Post #1,085
  • Quote
  • Oct 19, 2016 6:53pm Oct 19, 2016 6:53pm
  •  Monokl
  • Joined Feb 2012 | Status: Trade like Water | 3,380 Posts
Quoting Trade.Time
Disliked
Hi compro99, The method of this thread is quite simple but I to had trouble understanding it clearly. I suggest you give the last 10 pages a good read. After that I found it beneficial to write it out in my own words as below:- When Price is Up Buy; When Price is Down Sell - The Basics! 1/- Monthly/Daily combination for Monthly Uptrend: The trend is determined by last month's bar. Check the Monthly Chart. If the last monthly bar close is up (a bullish candle), the trend is up. On the daily chart, the daily bias is determined by the relationship...
Ignored
Can't wait to hear from you soon. TQ
Let Market Tell You
 
 
  • Post #1,086
  • Quote
  • Edited 1:26am Oct 20, 2016 1:14am | Edited 1:26am
  •  sunshine
  • Joined Mar 2007 | Status: Member | 1,190 Posts
Hello Traders

i will come back to the questions raised as well as the good understanding displayed by Trade.Time and others later, God Willing...

in the meantime here are some current trades as well as recently closed trades.
u will also notice there are some losses on the 2 Daily charts, but i want u to focus on the entry signals, both the gains and losses.

  1. all the bars that produce the entry signal, both long & shorts, are highlighted for information purposes and clarity of understanding.

  1. the Daily Charts entries are M+D combo and
  2. the 1hr chart entry is based on Dly+1hr combo, the other visible entry is M+D combo.

  1. the intraday trades have their Profit Targets entered.
  2. both the GBPUSD & GBPJPY have intraday trades with PT's as can be seen on the chart.

the MA is a 20bar ema for anyone wondering.

Attached Image (click to enlarge)
Click to Enlarge

Name: EURGBP+GBPUSD+GBPJPY thurs mrning20Oct2016.png
Size: 46 KB
 
 
  • Post #1,087
  • Quote
  • Oct 20, 2016 1:56am Oct 20, 2016 1:56am
  •  sunshine
  • Joined Mar 2007 | Status: Member | 1,190 Posts
and here is another Dly chart on which the Signal bars have green X above them.
the combo used is obvious, the M+Dly which in this case means our trading Bias is Down when looking for trades on Dly chart.
this is visual part answer to the trading bias question from trader Compro99

all the yellow lines are the Stop Loss placements, obviously.

Attached Image
 
 
  • Post #1,088
  • Quote
  • Oct 21, 2016 2:07am Oct 21, 2016 2:07am
  •  sunshine
  • Joined Mar 2007 | Status: Member | 1,190 Posts
GBPCAD Dly updated chart

  1. all shorts closed for more than 3,000 pips,
  2. new Daily buy entered on close yesterday above LSH
  3. chart for explanation purposes because there are some traders who still unsure about this method and its different strategies.

Attached Image
 
 
  • Post #1,089
  • Quote
  • Oct 23, 2016 12:18am Oct 23, 2016 12:18am
  •  Trade.Time
  • | Joined Apr 2014 | Status: Member | 48 Posts
Quoting sunshine
Disliked
GBPCAD Dly updated chart all shorts closed for more than 3,000 pips, new Daily buy entered on close yesterday above LSH chart for explanation purposes because there are some traders who still unsure about this method and its different strategies. {image}
Ignored
Well done Sunshine. It's great when you get a run - it's definitely a trend following system.
 
 
  • Post #1,090
  • Quote
  • Oct 23, 2016 11:20am Oct 23, 2016 11:20am
  •  sunshine
  • Joined Mar 2007 | Status: Member | 1,190 Posts
Quoting Trade.Time
Disliked
Hi compro99, The method of this thread is quite simple but I to had trouble understanding it clearly. I suggest you give the last 10 pages a good read. After that I found it beneficial to write it out in my own words as below:- When Price is Up Buy; When Price is Down Sell - The Basics! 1/- Monthly/Daily combination for Monthly Uptrend: The trend is determined by last month's bar. Check the Monthly Chart. If the last monthly bar close is up (a bullish candle), the trend is up. On the daily chart, the daily bias is determined by the relationship...
Ignored
thank you Trade.Time u have grasped the different strategies, welldone

just remember that when we mention LSH and LSL, we are really referring to the closing prices of that highs, in other words, the closing prices of the swings... not the actual highest point of the high {LSH} or the lowest point of the LSL.
 
 
  • Post #1,091
  • Quote
  • Oct 23, 2016 11:39am Oct 23, 2016 11:39am
  •  sunshine
  • Joined Mar 2007 | Status: Member | 1,190 Posts
Quoting compro99
Disliked
Clarify my doubt, Bias is based on last weekly/monthly candle UP/DOWN or break of last HIGH/LOW ?
Ignored
hello compro99,

thank you for your question that gives me a chance to reiterate and re-inforce what is meant.

  1. trading Bias 1: if you're trading the Dly timeframe then your trading bias will come from how the last month closed, uP or Down. If last month, September closed red or Down then our bias for the new month of October will be short, in other words, we will switch to the Dly tf and enter short on bearish reversal bars {-brb's}. this is the trend-following strategy.
  2. trading Bias 2: should price close at or above LSH on the Daily chart, the trading bias now changes to longs. this means we will enter long trades.
  3. please see the next Daily chart of GBPCAD that i intend posting after this answer to you. on that chart, all the green signals and markings are Trend-following and all the white signals and markings refers to Counter-trend trades. this is so that hopefully the method with its different strategies will become clear to you and others.


  • Post #1,092
  • Quote
  • Edited 12:18pm Oct 23, 2016 11:56am | Edited 12:18pm
  •  sunshine
  • Joined Mar 2007 | Status: Member | 1,190 Posts
Quoting Trade.Time
Disliked
{quote} Well done Sunshine. It's great when you get a run - it's definitely a trend following system.
Ignored
thank you Trade.Time
below is the result of that trading signal and entry that i posted on friday.

  1. the ct trade is about 100 pips in gains, {pips not pippets, i see so many traders refer the 5 digit pricing incorrectly thereby wrongly magnifying their gains and/or losses, usually inflating gains}
  2. SL has been moved to break-even plus one or two pips,
  3. the reality is that i do not know if price will reverse or continue up, so at least i have a protective measure in place, especially since this trade is held over the weekend which is always risky.

EDIT: see how deep fridays retracement was, if u do not believe in the strategy then anyone that popped-in and looked at their charts during that retrace would have closed it for a loss... so before anyone trade any method and strategy live it is of vital importance that you really believe in it.

Attached Image
 
 
  • Post #1,093
  • Quote
  • Oct 23, 2016 12:01pm Oct 23, 2016 12:01pm
  •  sunshine
  • Joined Mar 2007 | Status: Member | 1,190 Posts
Quoting compro99
Disliked
Clarify my doubt, Bias is based on last weekly/monthly candle UP/DOWN or break of last HIGH/LOW ?
Ignored
hi compro99,
that chart and signal is for your benefit, please check it out, thank you.
 
 
  • Post #1,094
  • Quote
  • Oct 23, 2016 12:05pm Oct 23, 2016 12:05pm
  •  compro99
  • | Joined Aug 2004 | Status: Member | 481 Posts
Quoting sunshine
Disliked
{quote} Hello LearnAlways, As promised, let's do some clarifying...if any of my answers cause confusion to u or any other interested member please ask, OR if my understanding of your question is flawed, please do tell, thank you all. let's answer your question in order; Q1.a) You are using the LINE graph to better visualize in seeing basically 2 things being namely the MOST CURRENT TREND based on month or week by using the SLOPE of the LINE. Answer: yes, correct. Q1.b) All the BIG & SMALL SWINGS HIGH/LOW Answer: Not entirely correct,...
Ignored
Sunshine, what you said about last month UP/DOWN monthly candle is different on post 62 where u use last recent swing high/low to determine Trend Bias.
That is where to confusion start...for me.
The future depends on what we do in the present.
 
 
  • Post #1,095
  • Quote
  • Oct 23, 2016 12:13pm Oct 23, 2016 12:13pm
  •  sunshine
  • Joined Mar 2007 | Status: Member | 1,190 Posts
Quoting compro99
Disliked
{quote} Sunshine, what you said about last month UP/DOWN monthly candle is different on post 62 where u use last recent swing high/low to determine Trend Bias. That is where to confusion start...for me.
Ignored
ok, i understand, my apologies ... please follow closely the last 10 pages or so, i have presented the method much clearer with all the different strategies of trend following and counter trend.
 
 
  • Post #1,096
  • Quote
  • Edited 12:52am Oct 25, 2016 12:18am | Edited 12:52am
  •  sunshine
  • Joined Mar 2007 | Status: Member | 1,190 Posts
USDCAD...Daily & 4hr charts

  1. here is another example of a M+D=uP trade. in other words the last monthly bar closed uP and when the daily produced an uP bar we bought.

  1. included is the 4hr timeframe, its corresponding higher tf closed down the previous week but then the 4hr timeframe by itself produced a buy signal when it closed above its own LSH...that is the purple line and 'X"
  2. the dotted purple horizontal line indicates that should price close at/below that line then shorts will rule in 4hrs.

the colour codes on my charts:

  1. green "X" and arrows below a bar indicate that the higher Monthly tf closed uP. this colour signal is found on Daily charts. if above a signal bar then obviously the higher tf closed down... above or below the signal bar are trend-following signals
  2. orange "X" and arrows below a bar indicate that the higher Weekly tf closed uP. this colour signal is found on 4hr charts. if above a signal bar then obviously the higher tf closed down... above or below the signal are trend-following signals.
  3. white "X" and arrows indicate that price in the Daily tf closed above its own LSH or closed below its own LSL. this colour signal is found on Dly charts... these are counter-trend signals
  4. purple "X" and arrows indicate that price in the 4hr tf closed above its own LSH or closed below its own LSL. this colour signal is found on 4hr charts... these are counter-trend signals.


trader compro99 is it clear ?

Attached Image (click to enlarge)
Click to Enlarge

Name: USDCAD 4hr&Dly tues25Oct.png
Size: 22 KB
 
 
  • Post #1,097
  • Quote
  • Oct 25, 2016 4:47am Oct 25, 2016 4:47am
  •  sunshine
  • Joined Mar 2007 | Status: Member | 1,190 Posts
EURUSD 4hrs possible Counter-trend buy

i'm pre-empting the close of the signal, still 20 mins to go before the 4hr bar close, reason is, i won't be able to wait that long...gotto run... duty calls.
there is another reason i entered again, who can tell me by looking at the 4hr chart ?
Attached Image
 
 
  • Post #1,098
  • Quote
  • Oct 25, 2016 10:22am Oct 25, 2016 10:22am
  •  compro99
  • | Joined Aug 2004 | Status: Member | 481 Posts
Sunshine, i understood.

To be honest, your initial way of looking bias (post 62) is better and more 'logical'. Well, i gonna look at both way from now
The future depends on what we do in the present.
 
 
  • Post #1,099
  • Quote
  • Oct 26, 2016 1:38am Oct 26, 2016 1:38am
  •  Scrabie
  • | Joined Feb 2008 | Status: Member | 14 Posts
Quote
Disliked
i'm pre-empting the close of the signal, still 20 mins to go before the 4hr bar close, reason is, i won't be able to wait that long...gotto run... duty calls.
there is another reason i entered again, who can tell me by looking at the 4hr chart ?

You have momentum on your side? During second entry this entry bar was almost twice as big as previous bars and also wick interpretation is suggesting that buyers are in charge.
 
 
  • Post #1,100
  • Quote
  • Oct 26, 2016 2:47am Oct 26, 2016 2:47am
  •  sunshine
  • Joined Mar 2007 | Status: Member | 1,190 Posts
Quoting Scrabie
Disliked
{quote} You have momentum on your side? During second entry this entry bar was almost twice as big as previous bars and also wick interpretation is suggesting that buyers are in charge.
Ignored
yes, unfortunately the market manipulators was at it again... took out stops, but M+D gave a buy signal yesterday inspite of all these hot air blowers that somehow think that their lies are believed.
 
 
  • Trading Discussion
  • /
  • When Price is UP, buy; when Price is Down, sell short...
  • Reply to Thread
    • 1 525354Page 5556 57
    • 1 54Page 5556 57
0 traders viewing now
  • More
Top of Page
  • Facebook
  • Twitter
About FF
  • Mission
  • Products
  • User Guide
  • Media Kit
  • Blog
  • Contact
FF Products
  • Forums
  • Trades
  • Calendar
  • News
  • Market
  • Brokers
  • Trade Explorer
FF Website
  • Homepage
  • Search
  • Members
  • Report a Bug
Follow FF
  • Facebook
  • Twitter

FF Sister Sites:

  • Metals Mine
  • Energy EXCH
  • Crypto Craft

Forex Factory® is a brand of Fair Economy, Inc.

Terms of Service / ©2023