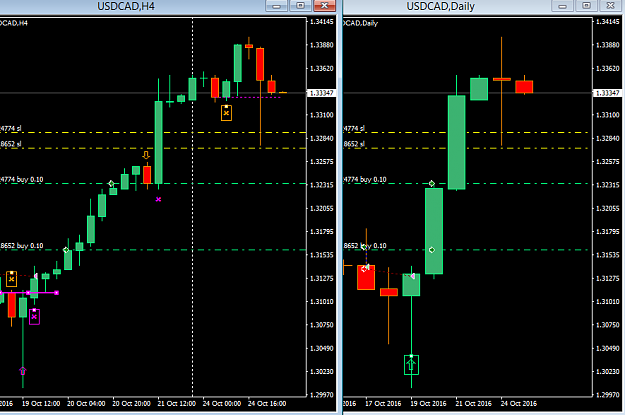
Disliked{quote} you're welcome Fadhl,and yes, USDCAD gave Wkly continuation signal bar and the 4hrs entry chart produced a buy entry. do not be concerned about Oil, there is no rule that the Loonie and Oil should move opposite.
Ignored
- Post #1,082
- Quote
- Oct 10, 2016 1:08am Oct 10, 2016 1:08am
- Joined Mar 2007 | Status: Member | 1,190 Posts
- Post #1,083
- Quote
- Oct 17, 2016 9:14am Oct 17, 2016 9:14am
The future depends on what we do in the present.
- Post #1,084
- Quote
- Oct 19, 2016 2:52pm Oct 19, 2016 2:52pm
- | Joined Apr 2014 | Status: Member | 48 Posts
- Post #1,085
- Quote
- Oct 19, 2016 6:53pm Oct 19, 2016 6:53pm
- Joined Feb 2012 | Status: Trade like Water | 3,383 Posts
Let Market Tell You
- Post #1,086
- Quote
- Edited 1:26am Oct 20, 2016 1:14am | Edited 1:26am
- Joined Mar 2007 | Status: Member | 1,190 Posts
- Post #1,087
- Quote
- Oct 20, 2016 1:56am Oct 20, 2016 1:56am
- Joined Mar 2007 | Status: Member | 1,190 Posts

- Post #1,088
- Quote
- Oct 21, 2016 2:07am Oct 21, 2016 2:07am
- Joined Mar 2007 | Status: Member | 1,190 Posts

- Post #1,089
- Quote
- Oct 23, 2016 12:18am Oct 23, 2016 12:18am
- | Joined Apr 2014 | Status: Member | 48 Posts
- Post #1,090
- Quote
- Oct 23, 2016 11:20am Oct 23, 2016 11:20am
- Joined Mar 2007 | Status: Member | 1,190 Posts
- Post #1,091
- Quote
- Oct 23, 2016 11:39am Oct 23, 2016 11:39am
- Joined Mar 2007 | Status: Member | 1,190 Posts
- Post #1,092
- Quote
- Edited 12:18pm Oct 23, 2016 11:56am | Edited 12:18pm
- Joined Mar 2007 | Status: Member | 1,190 Posts
- Post #1,093
- Quote
- Oct 23, 2016 12:01pm Oct 23, 2016 12:01pm
- Joined Mar 2007 | Status: Member | 1,190 Posts
- Post #1,094
- Quote
- Oct 23, 2016 12:05pm Oct 23, 2016 12:05pm
The future depends on what we do in the present.
- Post #1,095
- Quote
- Oct 23, 2016 12:13pm Oct 23, 2016 12:13pm
- Joined Mar 2007 | Status: Member | 1,190 Posts
- Post #1,096
- Quote
- Edited 12:52am Oct 25, 2016 12:18am | Edited 12:52am
- Joined Mar 2007 | Status: Member | 1,190 Posts
- Post #1,097
- Quote
- Oct 25, 2016 4:47am Oct 25, 2016 4:47am
- Joined Mar 2007 | Status: Member | 1,190 Posts
- Post #1,098
- Quote
- Oct 25, 2016 10:22am Oct 25, 2016 10:22am
The future depends on what we do in the present.
- Post #1,100
- Quote
- Oct 26, 2016 2:47am Oct 26, 2016 2:47am
- Joined Mar 2007 | Status: Member | 1,190 Posts