• Home
  • Forums
  • Trades
  • News
  • Calendar
  • Market
  • Brokers
  • Login
  • Join
  • User/Email: Password:
  • 7:22am
Menu
  • Forums
  • Trades
  • News
  • Calendar
  • Market
  • Brokers
  • Login
  • Join
  • 7:22am
Sister Sites
  • Metals Mine
  • Energy EXCH
  • Crypto Craft

Options

Bookmark Thread

First Page First Unread Last Page Last Post

Print Thread

Similar Threads

Fibo zones - the relation between today & yesterday OHLC 315 replies

Relation between binary and continuous variables? (In MatLaB) 4 replies

relation between profitability and extent of usage 3 replies

Relation between Nikkei 225 Index and Yen? 3 replies

relation between interest rate and forex 1 reply

  • Commercial Content
  • /
  • Reply to Thread
  • Subscribe
  • 5
Attachments: Relation between time and price
Exit Attachments

Relation between time and price

  • Last Post
  •  
  • Page 1 2
  • Page 1 2
  •  
  • Post #1
  • Quote
  • First Post: Edited Sep 13, 2016 8:59am Sep 12, 2016 3:36pm | Edited Sep 13, 2016 8:59am
  •  Xbeast
  • | Commercial Member | Joined May 2016 | 197 Posts
Can someone help me for code an mining Indicator which gets max. Data out of a chart and correlates with time and bull or bear candle of any tf and then mark that time in upcoming future on the same chart.
If bull appeared on that time for max times then plot it with blue line along with time and red for bear.
If any coders interested please sent me PM.
Or else if that sort of systems already exist then please share here so that we build more advance one.

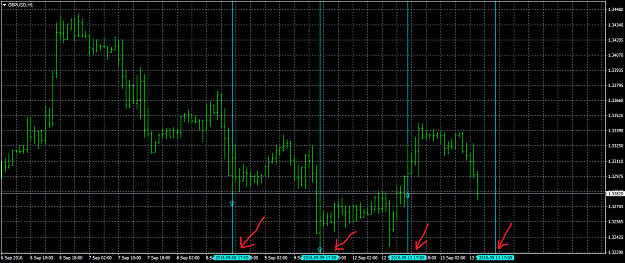
I'm looking for Indicator that uses past candles to predict future candle movements with respect to time. I want the predictions to be drawn as vertical lines on the right side of the chart where the market has not been yet. A red line for bearish movement and a green line for bullish movement along with probability number below arrow. A prediction will many times result in the type of candle (ex. bull or bear).
For example, I took 1hr chart of gbpusd and attached it below.Hope you will understand clearly.
Attached Image (click to enlarge)
Click to Enlarge

Name: gbpusd-h1-trading-point-of.png
Size: 32 KB
  • Post #2
  • Quote
  • Oct 6, 2016 3:42am Oct 6, 2016 3:42am
  •  Gorraf
  • Joined Aug 2016 | Status: Member | 125 Posts
Quoting Xbeast
Disliked
Can someone help me for code an mining Indicator which gets max. Data out of a chart and correlates with time and bull or bear candle of any tf and then mark that time in upcoming future on the same chart. If bull appeared on that time for max times then plot it with blue line along with time and red for bear. If any coders interested please sent me PM. Or else if that sort of systems already exist then please share here so that we build more advance one. I'm looking for Indicator that uses past candles to predict future candle movements with respect...
Ignored
Hello Xbeast!

According to your PM, I looked at your post and am still confused.

Define to me exactly what kind of data do you want to get out of the chart? What are you seeking or looking for? What should be compared? What is "max. Data"?

And to what? What does this mean: "If bull appeared on that time for max times "?


I might be able to help you, but I just don't get it what you want....

Gorraf
  • Post #3
  • Quote
  • Edited at 7:07am Oct 6, 2016 6:56am | Edited at 7:07am
  •  Xbeast
  • | Commercial Member | Joined May 2016 | 197 Posts
Quoting Gorraf
Disliked
{quote} Hello Xbeast! According to your PM, I looked at your post and am still confused. Define to me exactly what kind of data do you want to get out of the chart? What are you seeking or looking for? What should be compared? What is "max. Data"? And to what? What does this mean: "If bull appeared on that time for max times "? I might be able to help you, but I just don't get it what you want.... Gorraf
Ignored
Hi gorraf,
I will explain you clearly in this post and leave the 1st post.

Indicator have to do two things:
1.It has to display vertical line on the right hand side of the chart where the market does'nt reached yet.

properties of the vertical lines are
*These vertical lines are highest percentage of getting bullish or bearish candle at that time.
For example,if we want to plot a vertical line on 16:00 hour in 1hour timeframe chart then consider 16:00 hour candle of previous N days and if the highest percentage is bull candle then display as blue color vertical line or red color vertical line for bear candle along with percentage number on the top of the line.

Give external parameter for percentage of vertical line so that we can limit low percentage lines.


2.It has to display the probability percentage of getting bull or bear candle for upcoming next candle.

properties of probability percentage are
*we want to take N candle pattern with their time period along with present moving candle and correlate in historical data with respect to that time period and then display the percentage of getting next candle as bull on top of the present candle and percentage of getting bear on bottom of present candle.
For example,if the market is moving in 06:00 hour candle in 1hour timeframe chart then consider 01:00 hour - 06:00 hour pattern and then correlate with historical 01:00 hour -06:00 hour candles to find the percentages of upcoming 7:00hour candle be bull or bear.

let number of candles considered for pattern formation be in external parameter so that we can get good accuracy.


I wish this Indicator to work on all timeframes.

If the job is done then sent the file to me as I stated in the PM.

Advance thanks to Gorraf.
  • Post #4
  • Quote
  • Edited at 10:19am Oct 11, 2016 8:16am | Edited at 10:19am
  •  Gorraf
  • Joined Aug 2016 | Status: Member | 125 Posts
Hi!

I had a bit of time to fiddle with this indicator!

Workflow:
According to point 1 of the upper post, the hour and minute can be set for a candle, that we want to predict based on past data.
The bars in the chart, where the data is gathered from will be marked with an orange arrow.
A text will appear in the place of the predicted bar according to the request, whether it will be bullish or bearish, and with a percentage marker.

According to point 2, the bar, which is currently forming will be also checked in the history.
If the "Bars to considered..." is set to 0, the indicator will only check the bars which were formed at the same time in the past.
If it set to 1, or a higher number, it will also check, whether the patter was the same or not before.
If the indicator checks the pattern, the percentage of the bull/bear candle will be based upon, the chases of correct pattern detection, meaning, that, if the pattern does not match, the past pattern, it will lover the percentage.

Gorraf
Attached File
File Type: ex4 ProblemSolving_Xbeast_161011_ind.ex4   27 KB | 119 downloads
  • Post #5
  • Quote
  • Oct 11, 2016 8:35am Oct 11, 2016 8:35am
  •  Xbeast
  • | Commercial Member | Joined May 2016 | 197 Posts
Quoting Gorraf
Disliked
Hi! I had a bit of time to fiddle with this indicator! Workflow: According to point 1 of the upper post, the hour and minute can be set for a candle, that we want to predict based on past data. The bars in the chart, where the data is gathered from will be marked with an orange arrow. A text will appear in the place of the predicted bar according to the request, whether it will be bullish or bearish, and with a percentage marker. According to point 2, the bar, which is currently forming will be also checked in the history. If the "Bars to considered..."...
Ignored
Bravo bravo.. .let's check
  • Post #6
  • Quote
  • Oct 11, 2016 4:53pm Oct 11, 2016 4:53pm
  •  Xbeast
  • | Commercial Member | Joined May 2016 | 197 Posts
Quoting Gorraf
Disliked
Hi! I had a bit of time to fiddle with this indicator! Workflow: According to point 1 of the upper post, the hour and minute can be set for a candle, that we want to predict based on past data. The bars in the chart, where the data is gathered from will be marked with an orange arrow. A text will appear in the place of the predicted bar according to the request, whether it will be bullish or bearish, and with a percentage marker. According to point 2, the bar, which is currently forming will be also checked in the history. If the "Bars to considered..."...
Ignored
It should have external option that no. Of days to be considered.
There is percentage error.
89bars bullish out of 159bars and showing 89% bullish.
89/159=0.5597*100=55.97%.
It need to show 55.97%bullish possible.
And I don't know that the same error about the percentage above and below bars also exsist.?.
In some charts,Indicator only showing "text"" text".?
Some showing in 1hr chart.

Colors are perfect.
  • Post #7
  • Quote
  • Oct 11, 2016 7:42pm Oct 11, 2016 7:42pm
  •  Hmsr
  • Joined May 2016 | Status: Member | 322 Posts
@xbeast
Gorraf also made an indicator that graphs the numbers of highs and lows for a given N periods back. It tables which hours had highs and lows. Perhaps you can brainstorm a way to combine both ideas.
Attached File
File Type: ex4 ProblemSolving_Highs lows.ex4   40 KB | 138 downloads
HMSR
  • Post #8
  • Quote
  • Oct 12, 2016 4:56am Oct 12, 2016 4:56am
  •  Gorraf
  • Joined Aug 2016 | Status: Member | 125 Posts
Quoting Xbeast
Disliked
{quote} It should have external option that no. Of days to be considered. There is percentage error. 89bars bullish out of 159bars and showing 89% bullish. 89/159=0.5597*100=55.97%. It need to show 55.97%bullish possible. And I don't know that the same error about the percentage above and below bars also exsist.?. In some charts,Indicator only showing "text"" text".? Some showing in 1hr chart. Colors are perfect.
Ignored
- I have located the issue which caused the percentage error, and corrected it.
- The external option, regarding days to be considered are in, by the name of "sampling start".
- Some information about, where the indicator show only "text" "text" might be hepful.

Gorraf
Attached File
File Type: ex4 ProblemSolving_Xbeast_161011_ind.ex4   27 KB | 148 downloads
  • Post #9
  • Quote
  • Oct 12, 2016 5:11am Oct 12, 2016 5:11am
  •  Xbeast
  • | Commercial Member | Joined May 2016 | 197 Posts
Quoting Gorraf
Disliked
{quote} - I have located the issue which caused the percentage error, and corrected it. - The external option, regarding days to be considered are in, by the name of "sampling start". - Some information about, where the indicator show only "text" "text" might be hepful. Gorraf {file}
Ignored
Now it is working cool
but the percentage above candle are showing 23%bull - 24.5%bear??
is it for 100% or 50%.

it is working for 1m - 30m tf and not for 1hr tf

other issues are fixed.
  • Post #10
  • Quote
  • Oct 12, 2016 5:40am Oct 12, 2016 5:40am
  •  Xbeast
  • | Commercial Member | Joined May 2016 | 197 Posts
Quoting Gorraf
Disliked
{quote} Whoops! Thanks for noticing that. I should drink a coffee... {file}
Ignored
ALL clear
now the bars considered for prediction is not working??
  • Post #11
  • Quote
  • Oct 12, 2016 5:45am Oct 12, 2016 5:45am
  •  Xbeast
  • | Commercial Member | Joined May 2016 | 197 Posts
Quoting Gorraf
Disliked
{quote} Whoops! Thanks for noticing that. I should drink a coffee... {file}
Ignored
bars considered for prediction is not working.. percentage remaining same for any number of bars
  • Post #12
  • Quote
  • Oct 12, 2016 6:33am Oct 12, 2016 6:33am
  •  Gorraf
  • Joined Aug 2016 | Status: Member | 125 Posts
I just looked over the code and tried to recall what the intention was in the coding process.

The percentages did not needed to be fixed, because they were intentionally not added up nor to 50% or 100%.
As you have requested, the indicator, when predicting the next candle checks the pattern before the forming candle as well.
Now, if the pattern does not match the previous day's pattern, the bar marking the pattern will be red and the data will not be used in the prediction, since it is not a match.
Only data from the matching patterns are used in the indicator when predicting the forming candle.

The above is not true to the selected HH:MM candle prediction, since there is no pattern seeking. It only checks the bars marked with the orange arrow.

The indocator in post #8 is working as intended.

I also delete my post in position #10, because it's BS.

(Sorry about that, I have worked on four separate indicators yesterday and had some fight throught the night about some stupid things after my girlfriend got home.)

Gorraf
  • Post #13
  • Quote
  • Oct 12, 2016 6:39am Oct 12, 2016 6:39am
  •  Xbeast
  • | Commercial Member | Joined May 2016 | 197 Posts
Quoting Gorraf
Disliked
I just looked over the code and tried to recall what the intention was in the coding process. The percentages did not needed to be fixed, because they were intentionally not added up nor to 50% or 100%. As you have requested, the indicator, when predicting the next candle checks the pattern before the forming candle as well. Now, if the pattern does not match the previous day's pattern, the bar marking the pattern will be red and the data will not be used in the prediction, since it is not a match. Only data from the matching patterns are used in...
Ignored
okay that mean in post 10,the indicator is checking only the current candle and correlating.
  • Post #14
  • Quote
  • Oct 12, 2016 6:57am Oct 12, 2016 6:57am
  •  Gorraf
  • Joined Aug 2016 | Status: Member | 125 Posts
Quoting Xbeast
Disliked
{quote} okay that mean in post 10,the indicator is checking only the current candle and correlating.
Ignored
The indicator in post 10 didn't do the pattern analysis. And the red/blue boxes, marking the pattern didn't occur either.

The "bars considered..." is working as intended, however, the date of 1970.01.01 might be misleading.

The theoretical limit of sampling is 1970.01.01, but your EA might limit that if id does not have loaded the necessary data from history. (In small timeframes this usually happens and due to the limitations, on the M1 timeframe you can probably go back only a month or two.)
  • Post #15
  • Quote
  • Oct 17, 2016 1:43pm Oct 17, 2016 1:43pm
  •  Xbeast
  • | Commercial Member | Joined May 2016 | 197 Posts
Quoting Gorraf
Disliked
{quote} The indicator in post 10 didn't do the pattern analysis. And the red/blue boxes, marking the pattern didn't occur either. The "bars considered..." is working as intended, however, the date of 1970.01.01 might be misleading. The theoretical limit of sampling is 1970.01.01, but your EA might limit that if id does not have loaded the necessary data from history. (In small timeframes this usually happens and due to the limitations, on the M1 timeframe you can probably go back only a month or two.)
Ignored
Second indi gives 60% accurate signals in m30.
Does the time series forecast can be used to predict next candle,along with our strategy ??
  • Post #16
  • Quote
  • Oct 17, 2016 1:50pm Oct 17, 2016 1:50pm
  •  Xbeast
  • | Commercial Member | Joined May 2016 | 197 Posts
Quoting Gorraf
Disliked
{quote} The indicator in post 10 didn't do the pattern analysis. And the red/blue boxes, marking the pattern didn't occur either. The "bars considered..." is working as intended, however, the date of 1970.01.01 might be misleading. The theoretical limit of sampling is 1970.01.01, but your EA might limit that if id does not have loaded the necessary data from history. (In small timeframes this usually happens and due to the limitations, on the M1 timeframe you can probably go back only a month or two.)
Ignored
For your reference and formulas
http://support2.dundas.com/OnlineDoc...recasting.html
  • Post #17
  • Quote
  • Oct 18, 2016 10:21pm Oct 18, 2016 10:21pm
  •  Xbeast
  • | Commercial Member | Joined May 2016 | 197 Posts
Quoting Hmsr
Disliked
@xbeast Gorraf also made an indicator that graphs the numbers of highs and lows for a given N periods back. It tables which hours had highs and lows. Perhaps you can brainstorm a way to combine both ideas. {file}
Ignored
I don't know how to use that info from that indicactor.
You should consider the wicks of candle for your candle probability Indicator in free request thread so,it might give good accuracy.
  • Post #18
  • Quote
  • Aug 29, 2017 2:16am Aug 29, 2017 2:16am
  •  Xbeast
  • | Commercial Member | Joined May 2016 | 197 Posts
The most advanced FREE neural network & astronomical trading signals http://www.myfxpair.com/astrological-trading-signal/ which can be used for forex ,binary options and gold,silver trading.
  • Post #19
  • Quote
  • Sep 9, 2017 4:16am Sep 9, 2017 4:16am
  •  Xbeast
  • | Commercial Member | Joined May 2016 | 197 Posts
Inserted Video

fastest football player
100m simulation
comparison
fastest footballer
  • Post #20
  • Quote
  • Sep 9, 2017 9:53am Sep 9, 2017 9:53am
  •  Xbeast
  • | Commercial Member | Joined May 2016 | 197 Posts
https://www.fiverr.com/xbeast0/do-1k...t_url&utm_term
twitter retweets promotion
twitter promotion
1000 retweets
1000 likes
  • Commercial Content
  • /
  • Relation between time and price
  • Reply to Thread
    • Page 1 2
    • Page 1 2
0 traders viewing now
  • More
Top of Page
  • Facebook
  • Twitter
About FF
  • Mission
  • Products
  • User Guide
  • Media Kit
  • Blog
  • Contact
FF Products
  • Forums
  • Trades
  • Calendar
  • News
  • Market
  • Brokers
  • Trade Explorer
FF Website
  • Homepage
  • Search
  • Members
  • Report a Bug
Follow FF
  • Facebook
  • Twitter

FF Sister Sites:

  • Metals Mine
  • Energy EXCH
  • Crypto Craft

Forex Factory® is a brand of Fair Economy, Inc.

Terms of Service / ©2021