Can someone help me for code an mining Indicator which gets max. Data out of a chart and correlates with time and bull or bear candle of any tf and then mark that time in upcoming future on the same chart.
If bull appeared on that time for max times then plot it with blue line along with time and red for bear.
If any coders interested please sent me PM.
Or else if that sort of systems already exist then please share here so that we build more advance one.
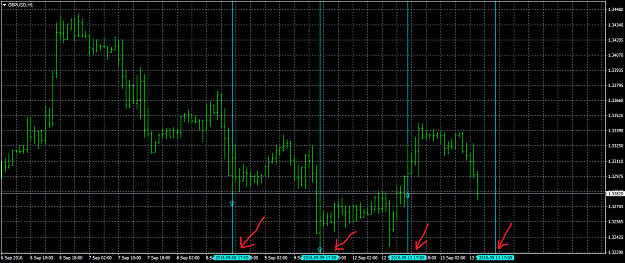
I'm looking for Indicator that uses past candles to predict future candle movements with respect to time. I want the predictions to be drawn as vertical lines on the right side of the chart where the market has not been yet. A red line for bearish movement and a green line for bullish movement along with probability number below arrow. A prediction will many times result in the type of candle (ex. bull or bear).
For example, I took 1hr chart of gbpusd and attached it below.Hope you will understand clearly.
If bull appeared on that time for max times then plot it with blue line along with time and red for bear.
If any coders interested please sent me PM.
Or else if that sort of systems already exist then please share here so that we build more advance one.
I'm looking for Indicator that uses past candles to predict future candle movements with respect to time. I want the predictions to be drawn as vertical lines on the right side of the chart where the market has not been yet. A red line for bearish movement and a green line for bullish movement along with probability number below arrow. A prediction will many times result in the type of candle (ex. bull or bear).
For example, I took 1hr chart of gbpusd and attached it below.Hope you will understand clearly.
Attached Image (click to enlarge)