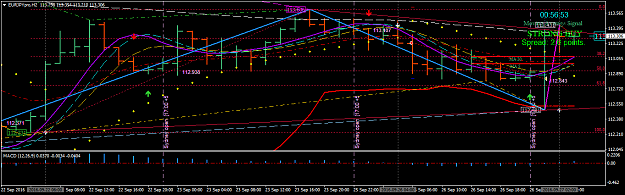
EURJPY
Date: 2016-09-23 2200 EDT
News for USD EUR JPY: HIGH at 1400 Local
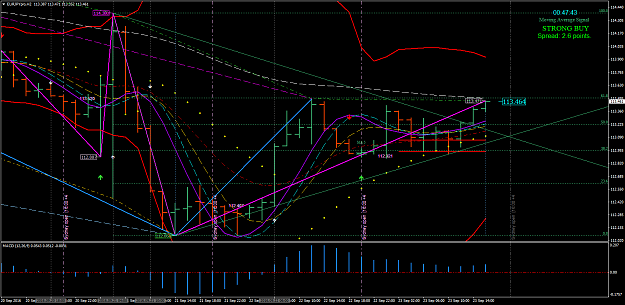
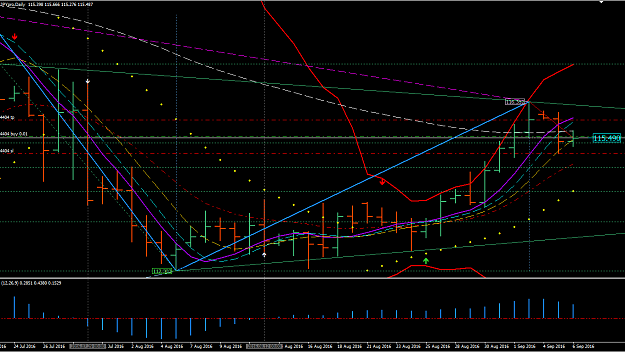
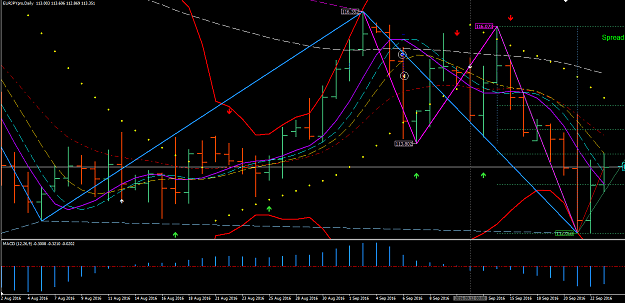
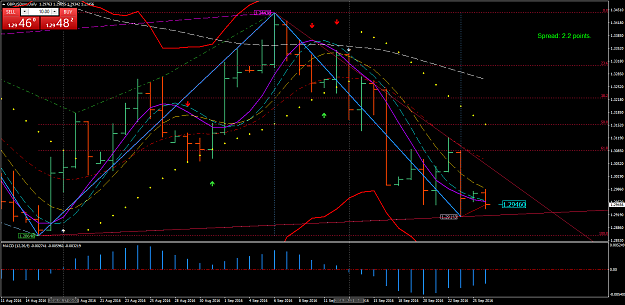
Daily:
ROMAR: R DN
EMA: R DN
PSAR: R DN
Last MACD 0 crossing: DN before EMA arrow
Last EMA Alert Arrow: DN
Last DB Attachment: 112.068B
Last SAR Attachment: 112.068B
Fibo up or down: UP
Notes: 4H downward, DB,SAR has LightSkyBlue outer box connection
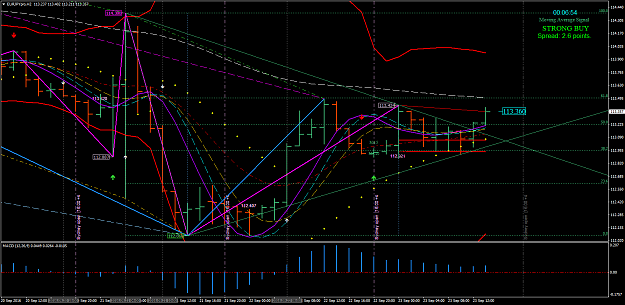
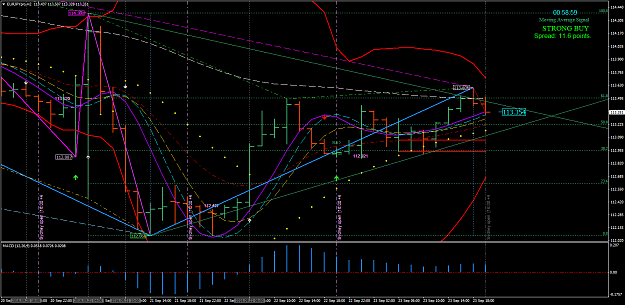
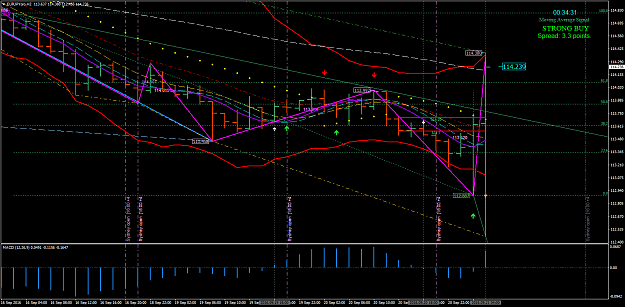
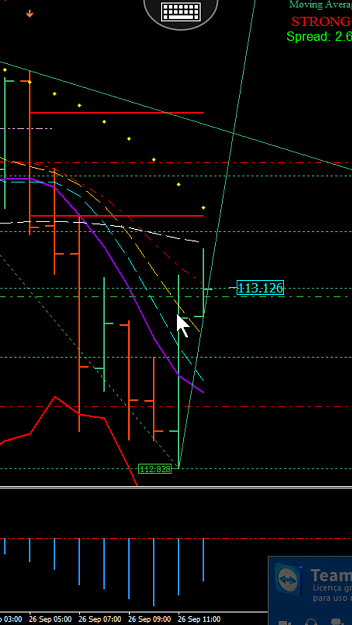
1HR: Open Price: 112.891
ROMAR: R DN
EMA: R DN
PSAR: S UP
Last MACD 0 crossing: UP
Last EMA Alert Arrow: UP
Fibo up or down: UP
Notes: 4H downward, W is at P at bottom of mini-swing, Market is above ROMAR resistance
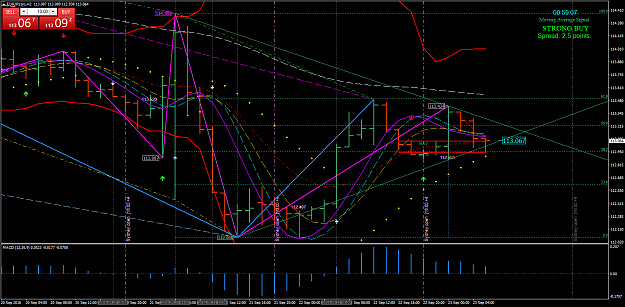
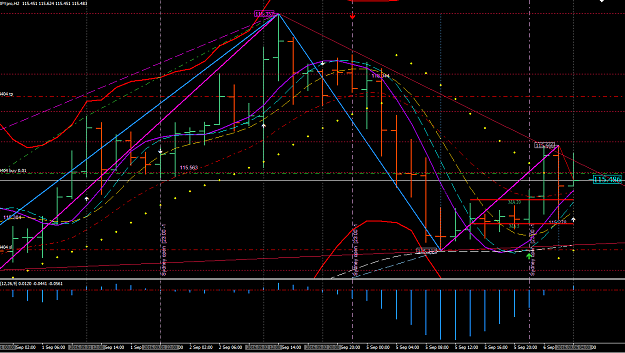
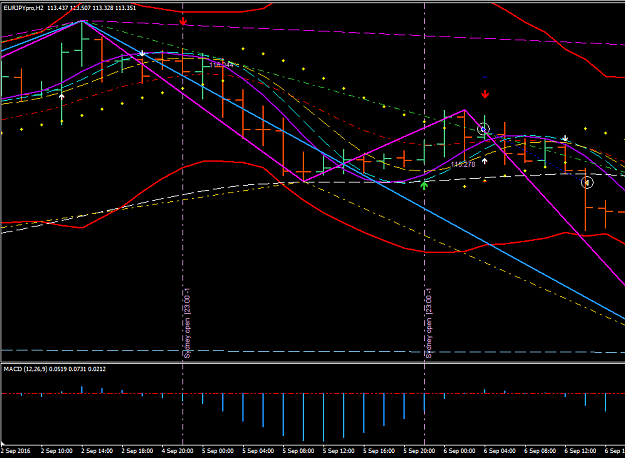
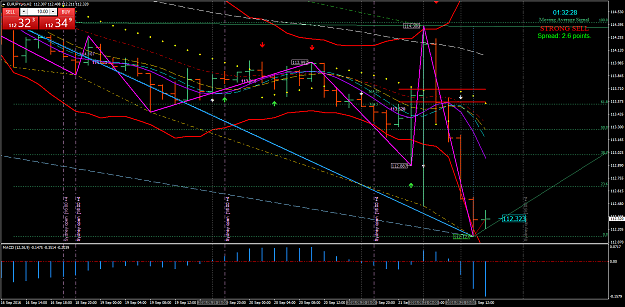
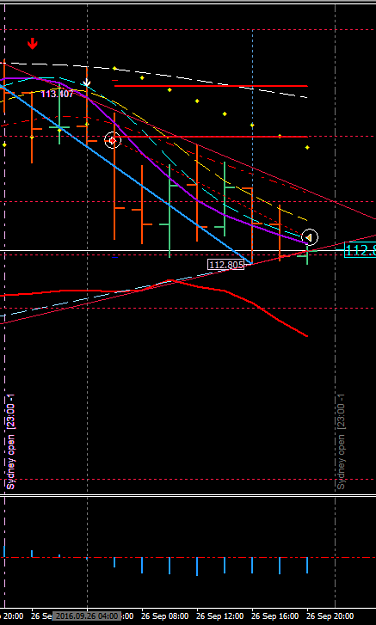
2HR:
ROMAR: R DN
EMA: S UP
PSAR: S UP
Last MACD 0 crossing: DN
Last EMA Alert Arrow: UP
Last DB Attachment: 113.490 T at Fibo 61.8
Last SAR Attachment: 113.424 T
Fibo up or down: UP
Notes: W,S crossed P, DB, SAR, Gold divergence and LightSkyBlue are all attached at 112.068, ROMAR is at 113.574
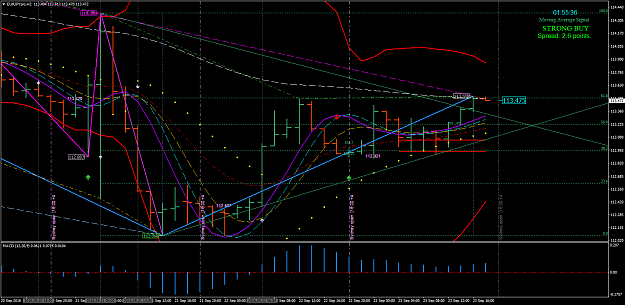
Notes for all 3 charts: 3TF ROMAR downward but Fibo's up. H2 EMA and PSAR are support
Entry: The market is above H1 ROMAR but I expect H2 ROMAR will provide significant resistance, therefore, I'll plan a short entry. First, H1 and H2 4H must be in sync. H2 SAR and DB, I expect, may join together below Fibo 0.0. When H2 PSAR is eliminated and intersects with EMA, I'll enter short at open below Smooth.
Result:
Date: 2016-09-23 2200 EDT
News for USD EUR JPY: HIGH at 1400 Local
Daily:
ROMAR: R DN
EMA: R DN
PSAR: R DN
Last MACD 0 crossing: DN before EMA arrow
Last EMA Alert Arrow: DN
Last DB Attachment: 112.068B
Last SAR Attachment: 112.068B
Fibo up or down: UP
Notes: 4H downward, DB,SAR has LightSkyBlue outer box connection
1HR: Open Price: 112.891
ROMAR: R DN
EMA: R DN
PSAR: S UP
Last MACD 0 crossing: UP
Last EMA Alert Arrow: UP
Fibo up or down: UP
Notes: 4H downward, W is at P at bottom of mini-swing, Market is above ROMAR resistance
2HR:
ROMAR: R DN
EMA: S UP
PSAR: S UP
Last MACD 0 crossing: DN
Last EMA Alert Arrow: UP
Last DB Attachment: 113.490 T at Fibo 61.8
Last SAR Attachment: 113.424 T
Fibo up or down: UP
Notes: W,S crossed P, DB, SAR, Gold divergence and LightSkyBlue are all attached at 112.068, ROMAR is at 113.574
Notes for all 3 charts: 3TF ROMAR downward but Fibo's up. H2 EMA and PSAR are support
Entry: The market is above H1 ROMAR but I expect H2 ROMAR will provide significant resistance, therefore, I'll plan a short entry. First, H1 and H2 4H must be in sync. H2 SAR and DB, I expect, may join together below Fibo 0.0. When H2 PSAR is eliminated and intersects with EMA, I'll enter short at open below Smooth.
Result: