Good Day Cyber, Another Year You posted this Double Bottom Indi which works so great and you mentioned that it was part of a Bigger Project you were working. Can you please help with an alert for that Indicator Please Sir and maybe an upgraded version if there is one, Thanks.
{quote} Sorry about that, I didn't had enough time yesterday to run a proper testing. I have revised the modifications i have made yestarday. Please check this one. {file}
Ignored
It appears to work great, thankyou very much.
The allowable errors is a major update.
-HMSR
Thanks Gorraf but it doesn't seem to have done the trick. The opening/price at 14:30 doesn't show up on the hourly chart. Don't worry about this though, I've decided that I don't mind using a 30 minute chart now. What I would really like though and if it is possible is for the defined bar to display as a different colour instead of having off having an object displayed on it. Thanks again, Mark
Ignored
Due to the nature of the chart, since there isn't a bar, on the 1H chart mathing the preferences you set in the input "14:30", the indicator can't find the bar related to it. If you change the minute input to 0, while inspecting the 1H chart, the markers should represent the opening of the 14:30 candle.
I could write a simple code, which could mark the price of any given time, on any given chart, up to one minute, if that's what you would like to see, and do the candle painting too, but I would prefer doing it from scratch rather than modifying this code further.
Don't know if this is possible or not but if so I would imagine it's an easy fix. I have the attached indicator that counts down to the closing of the bar. It currently displays in the format HH:MM:SS. Could this made to remove the hours and just display MM:SS?
{quote} Gorraf Thank you for coding such an useful indicator. I use 3 candles indicator (3 black while inside outside candle identifier) on 1 m chart to do scalping and most of the times it really helps on short-term time-frames. Now I will put your indicator also to find a useful pattern. Which means if the pattern is "ddd" and if it says 52% upward movement then fourth candle is supposed to go up by 52% of the preceding candle size if pattern repeats. Your indicator gives the count of occurrences but does not say about the lookback period to make...
Ignored
Hello simnz!
I have put together an indicator, which is still a work in progress, but has some of the funcionalities you requested.
- you can input a date, which is the beginning of the data sampling,
- you can input a threshold pip size,
- and you can input a threshold time limit in minutes
If it finds the matching growth/decline it highlights the starting bar with a white vertical line, and the closing one with a red or green, according to the direction of the move.
For now, the indicator works only on the minute chart, but I can tweak it later to operate on higher timeframes too.
I didnt write the log part as of yet, since I am still puzzled what to do if there is more, than ten or twenty results, which would flood the screen.
I need some user input from you, regarding the work in progress and the remarks, about which direction the indicator should take from here.
{quote} Hello simnz! I have put together an indicator, which is still a work in progress, but has some of the funcionalities you requested. - you can input a date, which is the beginning of the data sampling, - you can input a threshold pip size, - and you can input a threshold time limit in minutes If it finds the matching growth/decline it highlights the starting bar with a white vertical line, and the closing one with a red or green, according to the direction of the move. For now, the indicator works only on the minute chart, but I can tweak...
Ignored
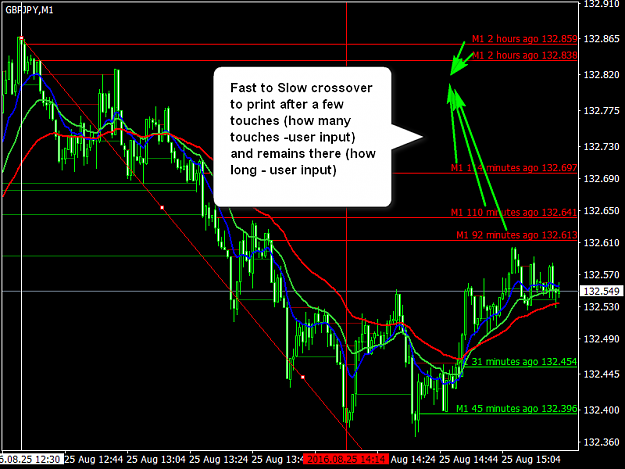
The intention is to (a) highlight the crossover point for certain time and (b) print a log of Moving Averages Crossovers and measure the distance of crossovers.
1. How long the highlighter stays is decided by user input. You are extending to higher TFs. Excellent. If you can draw a trendline from left high to low and right low to high, it will be good.
The highlighter will keep MA crossover points highlighted for time selected by the user.
2. The MA trader uses a 3 MA crossover system to establish trend, and trade on retracements, pullbacks, bounce-backs etc.
Three MAs will use Fast, Middle (medium) and Slow ones. Selection of MA type, period, and other inputs required by MA will be input by the user.
3. Four situations can happen: (a) Fast crossing Middle, (b) Fast Crossing Slow, (c) Middle Crossing slow and (d) all three consolidating.
How long they stay on the chart or get printed in the table log will be decided by user input.
If you can print (b) Fast Crossing Slow with time and price value printed as an horizontal line on the chart, that will be excellent. When and how long it stays there is
decided by the user.
For (a) pips distance of Fast Crossing (touching say fifth time ) Middle is printed in the log with time stamp along with direction
For (c) pips distance of Middle Crossing (touching say fifth time ) Slow is printed in the log with time stamp along with direction.
Hi Gorraf, Welcome to the club. Could you please code one Statistical indicator ? Print the length of the candle (in pips) on user inputting minimum size of candle and lookback period to know times such sudden movements happen, particularly in 1 minute chart, frequency and whether there is a regular pattern to it ? The indicator will highlight the candle and print a log/table in text on a selected corner of the chart. The table should show each candle size, low-high or high-low achieved in how many seconds/ticks and when (or bars ago). The intention...
Ignored
Dear Goraff,
The major part of the indicator is done by you.
This statistical indicator will highlight all the candles in the time threshold meeting the pip size threshold.
Please add few more inputs:
(a) TF: M1 or M5 or M15 etc.
(b) Max no of entries on the log: (Ascending or descending order of size of candles based on speed input (C)
(c) Speed of pips to time travelled in seconds (to define which maximum no of entries to be printed on the log)
If the indicator generates a big log of entries, the input of maximum no of bars for generation of log, will restrict it.
Example if the indicator highlights and generates 50 candles then only those candles (10) which took less time to travel 1 pip should be
selected for display.
Please leave this ratio of pips to second input to be decided by the user again.
I myself don't know what should be the ratio of pips to seconds should be. So I will experiment with the input and come to an conclusion.
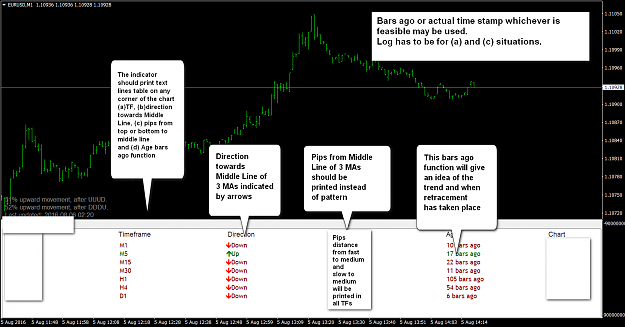
Display on table
Table will show following information about all candles filtered by the time and pip size input chart of TF selected by the user.
(a) time stamp (or bars ago) the high/low started
(b) distance from low-high or high-low achieved in how many seconds/ticks for the entire size journey.
(c) Size of the candle in pips on high or low
Display on Chart
It will highlight all the candles in the time threshold meeting the pip size threshold.
It will print Table as mentioned.
MA-based system
I have separately sent you a MA-based trading system based on your indicator. You can develop it whenever you have time. It is a quite profitable system which I am doing now manually.
{quote} Display on table Table will show following information about all candles filtered by the time and pip size input chart of TF selected by the user. (a) time stamp (or bars ago) the high/low started (b) distance from low-high or high-low achieved in how many seconds/ticks for the entire size journey. (c) Size of the candle in pips on high or low Display on Chart It will highlight all the candles in the time threshold meeting the pip size threshold. It will print Table as mentioned. MA-based system I have separately sent you a MA-based trading...
Ignored
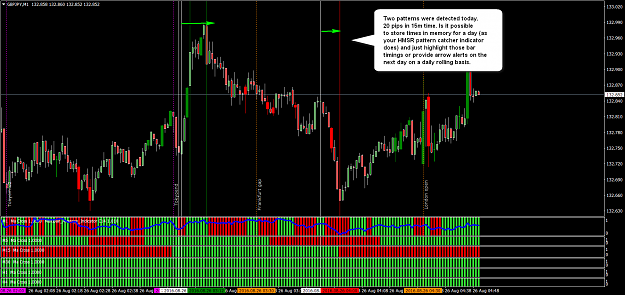
The log should have starting time and ending time for candles selected.
The intention is to catch the times and intensity of the moves to catch the timing pattern.
So, as promised, a bit of changelog, a bit of explanation:
The indicator is now working in all timeframes. (It gets the timeframe from the chart, it can't be changed individually.)
Due to that, the "threshold time in minutes" input has been changed to a "threshold bars" input.
The max number of results in the log is selectable from one to twenty.
The log contains the top ten (selected results/2) and the last ten (selected results/2) entries from the sorted list.
The logic of sorting is: "pip increment between high and low values" / "bars it needed to form". (Where the high and low values are within the same bar, the "bars it needed to form" value is set to 0.75).
"Speed of pips to time travelled in seconds input" is not added, due to the fact, that I might not understand what this might be.
MT4 does not register or store the forex data per second. The lowest programmable and recallable time value is 1 minute. (Well, this is not entirely true, since I have written an EA, which registers and stores the price data in every second, but that won't work here, since that needs to run, and save the current time/price data in itself to be able to work, and here, this wouldn't be beneficial.)
Since I wrote, that the smallest timeframe is one minute, you might assume, that, on a higher timeframe chart, it might be possible to watch the increment or decrement minute by minute, which might work if the beginning of the data sampling is not too far away, but might cause issues, if we seek patterns on a longer time span. The reason of this is the fact that the MT4 program loads the same amount of bars for each chart.
For example, if I set my MT4 program to show 10000 bars on each graph, that would mean 10000 hours on the 1H chart, but only 10000 minute on the 1M chart, which is ~166,6 hours (10000/60) and due to that, we couldn't use this method even on a one week long period, since the necessary data wouldn't be there, making the indicator unreliable.
The log displays the start of the pattern, the distance in bars, and the pip difference, as requested.
I hope this covers it all.
Feel free to test it, ask questions, suggest modifications, hunt bugs.
So, as promised, a bit of changelog, a bit of explanation: The indicator is now working in all timeframes. (It gets the timeframe from the chart, it can't be changed individually.) Due to that, the "threshold time in minutes" input has been changed to a "threshold bars" input. The max number of results in the log is selectable from one to twenty. The log contains the top ten (selected results/2) and the last ten (selected results/2) entries from the sorted list. The logic of sorting is: "pip increment between high and low values" / "bars it needed...
Ignored
Hi Gorraf,
Thank you for robustly coding the indicator.
Simply, the intention is to record the timings of the sudden burst of momentum and one minute TF is good enough. A
If the log recording the start and ending times can be created and exported through in a text format on a daily basis that will be excellent and it need not necessarily be displayed on the chart itself since the positions are anyway being highlighted.
I will stick to M1 TF. The first indicator did a good job.
Thank you once again educating us the logic and the working of MT4 platform.
{quote} Hi Gorraf, Thank you for robustly coding the indicator. Simply, the intention is to record the timings of the sudden burst of momentum and one minute TF is good enough. A If the log recording the start and ending times can be created and exported through in a text format on a daily basis that will be excellent and it need not necessarily be displayed on the chart itself since the positions are anyway being highlighted. I will stick to M1 TF. The first indicator did a good job. Thank you once again educating us the logic and the working of...
Ignored
Hello simnz!
I have added an export button to the indicator, so you can export the data you need, whenever you just want.
Additionally, you can diseable the log, if you don't want to see it, by selecting 0 from the "Maximal results in the log" dropdown menu.
{quote} Hello simnz! I have added an export button to the indicator, so you can export the data you need, whenever you just want. Additionally, you can diseable the log, if you don't want to see it, by selecting 0 from the "Maximal results in the log" dropdown menu. Gorraf {file}
Hello! I have very limited time nowadays, but when I have some free time, I'm still trying to code your ideas. Actually, I am on the run now as well, so test this version please, tomorrow I will write a little explanation about how it works and why. Gorraf {file}
Ignored
Hi Gorraf,
I find the first indicator which you coded with Minutes input threshold and working on M1 timeframe is serving the purpose well that of identifying the timings of the sudden burst of momentum in a couple of minutes and find a pattern of which hours are repeated in Asian session.
May I request you to add the export function linked with minutes instead of bars. You can restrict this indicator for use on M1 or M5 timeframe is OK if minutes threshold can be used only in that TF. Bars threshold is not really useful.
Kindly name it as a separate indicator.
Thank you again for your generosity in sharing your excellent coding work.
Hello Gorraf, if you have time, perhaps you could consider trying out this old idea from post #12 to the Problemsolving_HMSR indicator
►Perhaps a complex thing to add, in addition to manual input of U & D permutations, perhaps an option that allows the indicator to read the current last n bars on the graph and return a probabilty.
so INPUT
Automatic ----- True / False
automatic N bars ----n
For higher paced decisions. But it would be a pure luxury at the moment, definitely not a necessity.
and also
►A variable that finds the highest probability of setup witha given N
eg
Variable
highest probability permutation of N: (normally blank, if you enter any number n it will add a line above the other data with the permutation on the graph of length n that returns the highest probability, with cases listed aswell)