• Home
  • Forums
  • Trades
  • News
  • Calendar
  • Market
  • Brokers
  • Login
  • Join
  • User/Email: Password:
  • 8:55am
Menu
  • Forums
  • Trades
  • News
  • Calendar
  • Market
  • Brokers
  • Login
  • Join
  • 8:55am
Sister Sites
  • Metals Mine
  • Energy EXCH
  • Crypto Craft

Options

Bookmark Thread

First Page First Unread Last Page Last Post

Printable Version

Similar Threads

Free MT4 coding - Indicators, EAs, etc 390 replies

Free Coding: your systems 24 replies

Free Coding Request 2 replies

I Will Learn Coding in 1 Month - Give me the 80/20 of MT4 Coding 14 replies

Free Coding Request 0 replies

  • Platform Tech
  • /
  • Reply to Thread
  • Subscribe
  • 364
Attachments: Free Coding request
Exit Attachments

Free Coding request

  • Last Post
  •  
  • Page 1 23456 27
  • Page 1 234 27
  •  
  • Post #1
  • Quote
  • First Post: Edited Oct 9, 2016 8:43am Aug 3, 2016 5:32am | Edited Oct 9, 2016 8:43am
  •  Hmsr
  • Joined May 2016 | Status: Member | 318 Posts
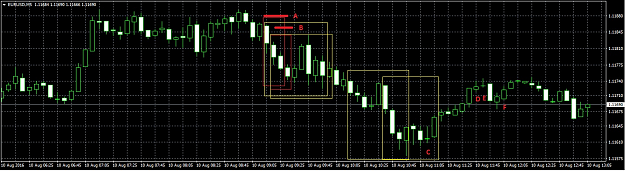
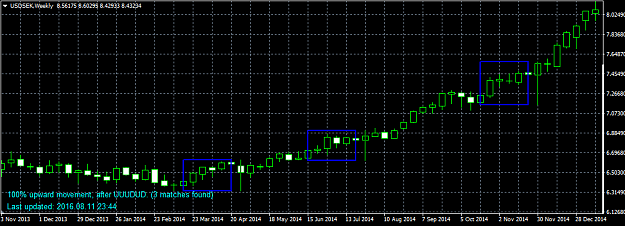
Hello, I am looking for an indicator/script where suppose, the last 4 completed candles or more are recorded, as perhaps "Up, Up, Up, Down"(how the candle closed, on say the hourly). I want an indicator that looks into history and finds any time this ordered pattern, (permutation) occurred. Next for every time an "U, U,U,D" occurred, it will record what happened on the next candle (either up or down) and give a probability ( eg. 45% Up, 55% Down) of what will happen in the next candle based on history.

-If anyone decides to code this please do send it to me compatible for mt4. I don't know how to code and I really need this to study the market. It's killing me that I am unable to do this.

-Regards Nayan

Update 18/8/16
Thankyou to Gorraf for completing the Problem solving indicator and Coverage Indicator, among others. Gorraf is competent in coding so be sure to check our his other projects. Post #137 has the solution to my above request. It is an analysis tool. May the force be with you. If you've discovered some great and consistent imbalances in some pairs do let me know
HMSR
  • Post #2
  • Quote
  • Aug 5, 2016 5:43am Aug 5, 2016 5:43am
  •  Gorraf
  • Joined Aug 2016 | Status: Member | 125 Posts
Hello Hmsr!

I had some free time looking into your request.

I hope this is what you wanted.

Gorraf
Attached File
File Type: ex4 ProblemSolving_Hmsr_160804_ind.ex4   9 KB | 447 downloads
  • Post #3
  • Quote
  • Aug 6, 2016 9:02am Aug 6, 2016 9:02am
  •  simnz
  • Joined Nov 2015 | Status: Member | 1,314 Posts
Hi Gorraf,

Welcome to the club.

Could you please code one Statistical indicator ?

Print the length of the candle (in pips) on user inputting minimum size of candle and lookback period to know times such sudden movements happen, particularly in 1 minute chart, frequency and whether there is a regular pattern to it ?

The indicator will highlight the candle and print a log/table in text on a selected corner of the chart.
The table should show each candle size, low-high or high-low achieved in how many seconds/ticks and when (or bars ago).

The intention is for the indicator to help ride the momentum of retracement/pullbacks/reversals or bounce back
Practice makes a person perfect
Golden 88 Pips Today: 0
  • Post #4
  • Quote
  • Aug 6, 2016 9:57am Aug 6, 2016 9:57am
  •  ilmel
  • | Joined Aug 2016 | Status: Junior Member | 2 Posts
Hi ! I am looking for a script or an indicator wich can save data from vertical lines on a chart into Excel : date, time and content of the line's describsion. If you have a possibility to code such a script it would be nice if the script considers separators in line's description to save data into diffrent columns.
What is it for ? For example, you test a new manual strategy on history. You put vertical lines in places of strategie's signals and in the description of the lines write additional info such as profit or loss, values of add. indicators etc..
Then the script saves all info into excel and you can filter and sort it. Thus we can collect results of a strategy very quickly. It would be great if you make such a script. Thank you.
  • Post #5
  • Quote
  • Aug 7, 2016 4:59pm Aug 7, 2016 4:59pm
  •  markpotter21
  • | Joined Mar 2009 | Status: Member | 31 Posts
I have come across this indicator to highlight a defined time bar. The problem is that I want to highlight the 14:30 bar and this only allows hourly selection. I'm sure it's a very easy change to allow "MarkHourGMT" to be inputted as 14:30 instead of an integer value of 14 but as I have no real experience I cannot find a way to do it after spending quite a lot of time on it. If anyone could help me I would appreciate it greatly.

//+------------------------------------------------------------------+
//| MarkTimeGMT.mq4 |
//| Copyright 2006, Charles W. Van Dien III |
//| mailto:{ email address deleted by staff }|
//+------------------------------------------------------------------+
#property copyright "Copyright 2006, Charles W. Van Dien III"
#property link "mailto: { email address deleted by staff }"
#property indicator_chart_window
#property indicator_buffers 1
#property indicator_color1 Orange
extern int MarkHourGMT=14; //change default GMT Hour here
extern int Shift=0;
extern int Arrow=119;
double MarkHour[];
//+------------------------------------------------------------------+
//| Custom indicator initialization function |
//+------------------------------------------------------------------+
int init() {
//---- indicators
SetIndexStyle(0,DRAW_ARROW,0,1); // change size of arrow here
SetIndexShift(0,Shift);
SetIndexDrawBegin(0,0);
SetIndexEmptyValue(0,0.0);
SetIndexArrow(0,Arrow); // change wingding symbol value here
SetIndexLabel(0,NULL);
SetIndexBuffer(0,MarkHour);
return(0);
}
//+------------------------------------------------------------------+
//| Custom indicator deinitialization function |
//+------------------------------------------------------------------+
int deinit() {
return(0);
}
//+------------------------------------------------------------------+
//| Custom indicator iteration function |
//+------------------------------------------------------------------+
int start() {
IndicatorShortName("Mark Hour GMT("+MarkHourGMT+")");
int limit=0;
int counted_bars=IndicatorCounted();
if(counted_bars<0) return(-1);
if(Period()>60) {
Alert("Chart must be H1 or below!");
}
if(counted_bars>0) counted_bars--;
int x=0;
limit=Bars-counted_bars;
for(x=0; x<limit; x++) {
if(TimeHour(Time[x])==MarkHourGMT && TimeMinute(Time[x])==0) {
MarkHour[x]=Open[x]; // change height of arrow above High here +20*Point
}
}
return(0);
}
//+------------------------------------------------------------------+
// Subroutines
//+------------------------------------------------------------------+
  • Post #6
  • Quote
  • Aug 7, 2016 5:19pm Aug 7, 2016 5:19pm
  •  rimazuc
  • | Joined Mar 2015 | Status: Member | 130 Posts
I have not tested this updates but i think you could try the following changes below.

I have added a new variable to allow you pass in the minute value below and added the logic to check if the minute is equivalent to the value in the variable.

Normally, "int" does not allow dots, only integers, changing the definition of the hour variable to "double" should allow you pass in values like 14.30 but this may not work as well. A string variable should allow values like 14:30 to be passed in also may not work well with the code.

Update the sections below

extern int MarkHourGMT=14; //change default GMT Hour here
extern int MarkMinuteGMT=30; //change default GMT Minute here //NEW

-----------------------------------------------
int x=0;
limit=Bars-counted_bars;
for(x=0; x<limit; x++) {
//if(TimeHour(Time[x])==MarkHourGMT && TimeMinute(Time[x])==0) { Commented out, UPDATED LINE BELOW
if(TimeHour(Time[x])==MarkHourGMT && TimeMinute(Time[x])==MarkMinuteGMT) {
MarkHour[x]=Open[x]; // change height of arrow above High here +20*Point
}
}
-------------------------------------------------------------------------------------------
  • Post #7
  • Quote
  • Edited Aug 8, 2016 9:07am Aug 7, 2016 11:52pm | Edited Aug 8, 2016 9:07am
  •  Hmsr
  • Joined May 2016 | Status: Member | 318 Posts
Quoting Gorraf
Disliked
Hello Hmsr! I had some free time looking into your request. I hope this is what you wanted. Gorraf {file}
Ignored
Hello Gorraf,
You are very close. Actually its pretty funny how you used UUUD specifically, though I was using that as an example. But the indicator has the right idea. See in your indicator if you could provide options, so that different parameters can be inputted too, that would be the finishing touch. So, suppose I want to see (UUUD), (UUU), (DDUDDUD), (DD) or (DUDDUD), literally any random order with any length, maybe up to 10 bars. Essentially a more versatile indicator that you can use at any time in order to historically/statistically predict a reverse or a trend continuation.

Eg, suppose the last 5 candles on an overall ranging up trend are, (DDDUD), and its near the bottom of the range, I suspect that it will go up based on channels/price action. I can now use the indicator to give a probability based on history whether the next candle will go up or down, and hence have an optimal entry.
n addition to that any extreme probabilities (such as 95% up on the next candle) are exploitable anytime.

Note: The aim is not to draw usefulness when there is a historic probability of say 60%UP & 40% down. That is not useful. It is to act when rare scenarios such as 90% up & 10% down occur in order to exploit different ordered patterns on different currencies. Imagine entering a trade into a trend where the historic probability is extremely high for the next candle (such as 95% Up on the next candle), that will do great for confidence in trades, and probably the win rate.

Goodluck, and thanks for your work so far!
HMSR
  • Post #8
  • Quote
  • Edited at 12:07pm Aug 8, 2016 11:03am | Edited at 12:07pm
  •  markpotter21
  • | Joined Mar 2009 | Status: Member | 31 Posts
I've been trying to reply rimazuc but as I am new here my comments go for moderation first. They seem to be taking a long time though so I will try again. The code works perfectly, thanks so much for your help
  • Post #9
  • Quote
  • Aug 8, 2016 7:24pm Aug 8, 2016 7:24pm
  •  rimazuc
  • | Joined Mar 2015 | Status: Member | 130 Posts
Quoting markpotter21
Disliked
I've been trying to reply rimazuc but as I am new here my comments go for moderation first. They seem to be taking a long time though so I will try again. The code works perfectly, thanks so much for your help
Ignored

Ok this is great. You welcome.
  • Post #10
  • Quote
  • Aug 9, 2016 2:37am Aug 9, 2016 2:37am
  •  Transarm
  • | Joined Jan 2016 | Status: Junior Member | 4 Posts
Is there any way to find out which currency gained the most and which currency lost the most within eg. a 15min candle?
  • Post #11
  • Quote
  • Aug 9, 2016 7:26am Aug 9, 2016 7:26am
  •  Gorraf
  • Joined Aug 2016 | Status: Member | 125 Posts
Sorry for the long delay between my posts, but I wasn't anywhere near my computer in the whole weekend.

Hmsr: Try out the updated indicator, I hope it will be more to your liking. Since you liked the U-D pattern style, you can now add your own pattern into it. (Hopefully, you can add a way longer pattern, that you will ever need to.)
As a bonus, I added two new features.
- the first lets you define the amount of pips which, regarding what is considered as valid up or down move.
- the second lets you modify the amount of candles included in defining the up/down move after the pattern you added.

Try it out, I hope it's somewhere near, what you have imagined.
Attached File
File Type: ex4 ProblemSolving_Hmsr_160804_ind.ex4   11 KB | 387 downloads
  • Post #12
  • Quote
  • Edited at 9:16am Aug 9, 2016 8:30am | Edited at 9:16am
  •  Hmsr
  • Joined May 2016 | Status: Member | 318 Posts
Quoting Gorraf
Disliked
Try it out, I hope it's somewhere near, what you have imagined. {file}
Ignored

Gorraf, you are a legend. I cannot express my gratitude. This is pretty much the indicator at its core. Feel free to respond whenever, this is your code. There is no urgency, I can do wonders with what you have already posted.

I hope you find it just as useful as I will.

►If I have any other suggestions to improve this for use, I will post it and let you know, in order to make this an optimal indicator for research and probabilistic analysis.
For now, I'd just like to know, how far back does the indicator consider when creating its probabilities? Maybe you can create another parameter in the inputs which can consider how many bars back to search for the U/D patterns, where 0 would mean all data, and any number n would be n bars back considered in that respective timeframe. This would help in considering scenarios such as post-gfc times, or the time period after a currency stopped being pegged etc.

►Perhaps a complex thing to add, in addition to manual input of U & D permutations, perhaps an option that allows the indicator to read the current last n bars on the graph and return a probabilty.
so INPUT
Automatic ----- True / False
automatic N bars ----n
For higher paced decisions. But it would be a pure luxury at the moment, definitely not a necessity.

►For the U/D parameter, is it limited to any length?

And a not so important thing, an option to change the colour of the text, for ease of access (in case it interferes with indicators or line studies etc.). Also, when the indicator is removed, it doesn't disappear from the graph.

In terms of use, just to clarify, for the variable (U/D Pattern), do you simply enter any order of 'U' and 'D', and that is correct, no other input only 'U' and 'D'. To confirm they need to be capitals. So far it seems to be so.

In terms of using this, I'd hypothesis that this indicator will bear the most fruit on longer time frames and relatively exotic currencies. And any probability close to 90% is usable.

All the best.
-HMSR

Ps. Potentially another project for you is to create some form of depiction of the normal distribution about the average move in pips. Or instead of the distribution just the probabilities associated with the standard deviations.. First in order to consider this, it needs to be confirmed that normal distribution is applicable. I need to revise my statistics
HMSR
  • Post #13
  • Quote
  • Aug 9, 2016 10:36am Aug 9, 2016 10:36am
  •  simnz
  • Joined Nov 2015 | Status: Member | 1,314 Posts
Quoting Gorraf
Disliked
Sorry for the long delay between my posts, but I wasn't anywhere near my computer in the whole weekend. Hmsr: Try out the updated indicator, I hope it will be more to your liking. Since you liked the U-D pattern style, you can now add your own pattern into it. (Hopefully, you can add a way longer pattern, that you will ever need to.) As a bonus, I added two new features. - the first lets you define the amount of pips which, regarding what is considered as valid up or down move. - the second lets you modify the amount of candles included in defining...
Ignored
Hi HMSR/Goraff,

I need your help as I am getting this error message even when I am just inputting one pattern: UUUD.

Can you please advise me right syntax for inputting for example a pattern like this: 12 bars in 1 minute TF happening UUUUUUUUDDDD
and want to it to compare the pattern in past history and say the probability of such pattern happening and affecting the prices by how many pips or percent.

A few more such examples with all three input fields will be quite helpful.

Thank you


I want to find
Attached Image (click to enlarge)
Click to Enlarge

Name: Input problem.jpg
Size: 98 KB
Practice makes a person perfect
Golden 88 Pips Today: 0
  • Post #14
  • Quote
  • Aug 9, 2016 10:56am Aug 9, 2016 10:56am
  •  simnz
  • Joined Nov 2015 | Status: Member | 1,314 Posts
PipValue3 indicator found in a FF thread is also good at catching a pattern for determining direction.

When among largest 5 bars if no. of bullish bars is greater than bearish then Buy mode and vice-versa is the signal emitted.
http://www.forexfactory.com/showthre...19#post8987519
Practice makes a person perfect
Golden 88 Pips Today: 0
  • Post #15
  • Quote
  • Aug 9, 2016 4:46pm Aug 9, 2016 4:46pm
  •  Gorraf
  • Joined Aug 2016 | Status: Member | 125 Posts
I have fixed a few things in the code and added some new messages, to inform you if it encounters any kind of error. Hopefully it won't now.

I have also added the ability to limit the bar range backwards, as Hmsr requested. (The second idea, about automatic pattern analyzation and recognition needs some brainstorming on my side.)

The string input is limited at 63 characters, however, the longer the pattern is, the likelihood of it's appearance decreases, and yes, you need to use capital "U" and "D" letters to define the pattern. Of course I can change that, if you want something else, or want to define the pattern differently.

simnz: Please check the version i upload to this post, and check whether the issues are still there. Thanks for the testing feedback.

(I will add the color changing line, and the text erasing upon indicator deletion, but gf wants to watch the olimpycs atm. )
Attached File
File Type: ex4 ProblemSolving_Hmsr_160804_ind.ex4   11 KB | 344 downloads
  • Post #16
  • Quote
  • Edited at 10:48am Aug 10, 2016 7:11am | Edited at 10:48am
  •  Hmsr
  • Joined May 2016 | Status: Member | 318 Posts
Hello Gorraf, it works great, thankyou very much.

►Perhaps another form of input into the U/D parameter, can be N-for Neutral or no move. To represent cases where the open equalled the close. They would be rare events, but this indicator idea is all about the accuracy. It would be much more relevant for lower time-frames so someone like Simnz can make the most use of the indicator.

One spark of good news, I found one instance where the indicator returned a 95% probability. Most of the time they are close to 60 percent as expected. The next highest I found was an 84%. In terms of which exact moment, I believe it was DDD on the USD/CAD on the Daily, however clearly it wasn't, I'm kicking myself I didn't make a mental note.


►Gorraf, just to clarify the principle or function of the indicator.
Suppose I enterred UUU, of length 3.
On the graph, suppose at one random time the permutation of UUUU occured of length 4.
There are two ways the indicator may deal with this,
1)It will read it as UUUU, and since it is 4, it will not consider it in the sample size of UUU length 3. (Which would be incorrect for me/ Unpreferred)
2)It will read it as U{UUU} and {UUU}U, and hence there will be 2 more entries in the sample pool to consider for probabilities. (Preferred)
Both cases are correct in terms of probability but the first case it harder to use because you have to consider tree-diagram versions of probabilities, ie very time consuming.

[Edit:]►Another thing which I realise is pivotal is for the indicator to state how many cases of the defined/inputted U/D permuation are caught/counted/found in the past bars/history. Eg. You enter a really long sequence and it gives 100% Down movement next, but only one case of such was found. Small data pool, no usable indication of price behavior. Where as 94% with 1800 cases found, on a very long pattern, now that's a pattern. That is an irregularity, perhaps an intangible pricing rule/structure that may be exploitable or may be good as a form of forecast etc.

@Simnz, the bugs appear to be mostly fixed on Gorrafs code. If there are bugs, try openning up a new page/graph and then using the indicator again.


On a side note, 3 major injuries already in the Olympics. It's a rough time out in Rio at the moment.
-HMSR
HMSR
  • Post #17
  • Quote
  • Aug 10, 2016 1:54pm Aug 10, 2016 1:54pm
  •  Gorraf
  • Joined Aug 2016 | Status: Member | 125 Posts
A few improvements and some explanation.

I have tweaked today the following things:
- text color can now be changed at the Input parameters (The default is yellow now),
- the texts, the indicator generates should now disappear if you remove the indicator,
- you can now use a letter "N" as neutral move in the pattern,
- there is now an extra sentence which shows the amount matching patterns, the indicator has found.

Explanation, regarding the workflow:
- The indicator seeks out the pattern you have entered and calculates the result regarding the bar, behind the pattern. Using your example, if you set the DDD (yeah, I know you have used UUU, but a DDD was just in front of me) pattern, when the indicator reaches the pattern marked with "A" on the picture, it will register the new bar as a down. If we would have only this matching sample, the result would be, that 1/1 pattern had a downwards moving bar after it.

Since the new bar is down again, the indicator will find another match, which is marked with "B". It does not take into consideration, what was before the located pattern, it is only interested in, what you have given it to search.
As the next bar after the "B" pattern is up, the indicator will register this and calculate the probability as from now as, from 2 matching patterns, there were one down, and one upwards going.

The chances of the next bar, after locating a pattern would be 50% upwards and 50% downwards. (Of course this is just an example of the workflow, to explain that chase 2 is in work.

- As I have mentioned, the letter "N" can now be used as a sign for Neutral candle. Of course this letter will make only sense if there is a value set in the indicator, regarding the minimal pip move to be considered as up, or down move. If you check the candles "C", "D" and "E", they all have some minor difference between their closing and opening prices, but I wouldn't consider any of them to be a valid move. This fine line should be decleared in pips, where candle "D" counts as neutral move, while "F" is a valid up move. (Of course, this is just an example, if you set it so, both will be up candles or both will be neutral.)
Of course, the pip value should be changed if the time frame changes, since there are larger movements in the hourly candles as you can find on the 5M ones and leaving it unaltered would cause false signals.

- I think there is another important setting, namely the amount of bars, following a pattern. To show you the issue, i have marked several "DDD" patterns, and the following 6 candles with a yellow rectangle.
As you can see, there four of these.
If we tell the indicator to inspect only the next bar, we would get the result, that only in one chase was the following bar going downwards, with 75% probability, the the bar following the pattern will go up.
Now, if we set the inspected range a bit further, this picture changes.

Attached Image (click to enlarge)
Click to Enlarge

Name: Screenshot1.png
Size: 210 KB


I hope this clears up most of the questions.

I will think about the automatic pattern recognition, I didn't had time for that yet.
Attached File
File Type: ex4 ProblemSolving_Hmsr_160804_ind.ex4   13 KB | 331 downloads
  • Post #18
  • Quote
  • Aug 11, 2016 4:34am Aug 11, 2016 4:34am
  •  Hmsr
  • Joined May 2016 | Status: Member | 318 Posts
Hello Gorraf, thanks for your excellent work and commitment.

Thanks for your explanation of the workflow, that was the method I was hoping for and easiest to understand. In fact, that picture is an excellent example for reference. ►Which gives me another, would it be possible to create an option on the indicator to show past cases/patterns found in that boxed format/representation as shown in your example/picture (Boxes showing the defined pattern, a seperator and then the however amount of candles after the pattern considered for probabalities), for manual past/historic analysis. Something like 'Show Pattern Position/Identification' with options 'true or false', something along those lines that is up to you. All I know it will be very useful,
I know so far the 'cases found' addition to this indicator has been very useful, for example (all other things being equal) getting 84% with 150 cases, that is confidence as opposed to 100% and 3 cases found.

In terms of the indicators defining of 'N'-Neutral candle recognition, is it that if the net pips/candle move is lower than the entered number into the 'minimum pips to consider' variable, than it is considered N-Neutral?

The addition of bars after the permutation was a great addition from you btw, excellent for long term patterns, it's very relevant.
So far, it feels great combining this indicator with other trading strategies, waiting out the lower probability patterns for the higher probability patterns to present themselves before entering a trade.
In terms of the automatic recognition, if you can do it, it will be useful, if not that's fine, you are a legend either way.

-HMSR
HMSR
  • Post #19
  • Quote
  • Aug 11, 2016 8:00am Aug 11, 2016 8:00am
  •  Gorraf
  • Joined Aug 2016 | Status: Member | 125 Posts
I have altered the code, to draw rectangles around the matching patterns and around the following bars, which is the base of data collecting.

  1. the found pattern is in a blue rectangle,
  2. if the following bars (the number depends from the setting, you give to the indicator) are in correlation with the current highest probability, are marked with green
  3. the following bars, which are against the current highest probability are marked with red.


You can change the colors to your liking.

Since the rectangles, or any kind of graphical elements, which are depending from the bars, they can only be anchored to a bar and can not be moved from there horizontally, so I cant make the side of a rectangle to appear in between two bars. The left side of the blue rectangles are cutting through vertically the first bar of the pattern, while their right side is cutting through the last bar of the pattern. The same applies to the following candles too, after a found match. If only one candle is analyzed the range of analyzed bars will be equal to a strainght horizontal line. If I find a workaround to this graphical issue, I will fix it, but I doubt there is one, since you cant do that manually either.

Your assumption about the Neutral move is correct. By adjusting the "Minimal amount of pips to be considered a valid movement." setting you define the threshold of, how small or big a movement should be. if the difference between the closing and opening prices exceeds the setting, (which is 0 by default) then the bar will be considered as a valid up or down move, depending form its direction. If the amount of move falls below or is equal with the set value, the move will be recognized as a Neutral move. This is true to the pattern recognition and to the followup bar analyzation as well.

Attached File
File Type: ex4 ProblemSolving_Hmsr_160804_ind.ex4   18 KB | 309 downloads
  • Post #20
  • Quote
  • Edited at 10:30am Aug 11, 2016 9:49am | Edited at 10:30am
  •  Hmsr
  • Joined May 2016 | Status: Member | 318 Posts
Hello Gorraf, I think there is a bug
As you can see in the picture, the permutation is UUUDUD. It says 100% up but only 2/3 bars went up after it. So the visuals don't appear to be the problem rather the recognition of the Up candle in the first example seen in the picture.
Attached Image (click to enlarge)
Click to Enlarge

Name: Untitled.png
Size: 20 KB


►Also another request for the indicator is if there can be an option to move it to other corners like top right etc, so it doesn't interfere with the graph etc.
Regards
►Also for the visuals (ie boxes on the graph) could you make an option to make them in go into the backround, ie for the graph bring to front. What I mean is that the graph should be identifyable over the visuals.If you look at the attachment, the wicks can't be seen.
For example, I can goto: right click>objects list>select specific visual>edit>select draw object as backround.

Regards
-HMSR
HMSR
  • Platform Tech
  • /
  • Free Coding request
  • Reply to Thread
    • Page 1 23456 27
    • Page 1 234 27
0 traders viewing now
  • More
Top of Page
  • Facebook
  • Twitter
About FF
  • Mission
  • Products
  • User Guide
  • Media Kit
  • Blog
  • Contact
FF Products
  • Forums
  • Trades
  • Calendar
  • News
  • Market
  • Brokers
  • Trade Explorer
FF Website
  • Homepage
  • Search
  • Members
  • Report a Bug
Follow FF
  • Facebook
  • Twitter

FF Sister Sites:

  • Metals Mine
  • Energy EXCH
  • Crypto Craft

Forex Factory® is a brand of Fair Economy, Inc.

Terms of Service / ©2021