Disliked{quote} thanks for your time & help... If you have time please post your top down analysis on EURCAD for study purpose ... i mean HTF to LTF analysis & it will help me alot to learn SND trading (hope you understand ) .. again thank a lots for the thread ..
Ignored
In the meantime this top down EURCAD analysis is just some quick stuff (getting head back into charts after a few days away).
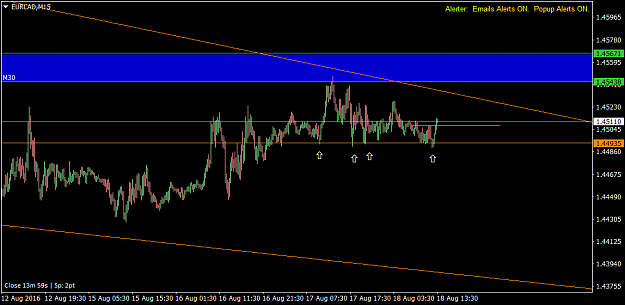
EURCAD MN
Chaos. I wouldn't even bother analysing.
Attached Image (click to enlarge)
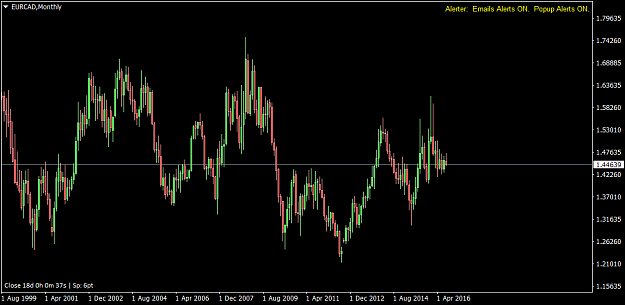
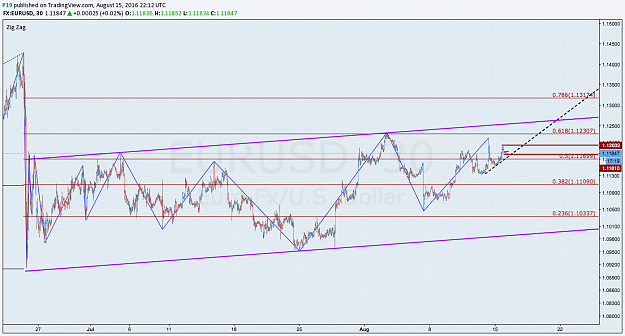
EURCAD W1
Similarly chaos. I personally wouldn't bother analysing because in trading/profit terms I see no opportunity.
Attached Image (click to enlarge)
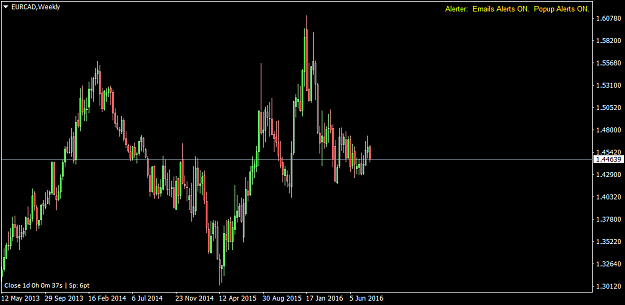
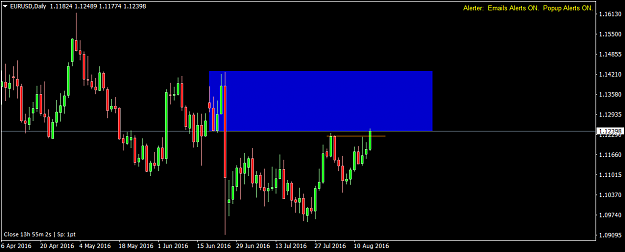
EURCAD D1
This is where things start to look interesting. There's 3 x Daily charts. Here's the first:
Pole+flag sort of stuff with the first test of the base of the pole quite a few days ago. The move away was
tepid to say the least.
Attached Image (click to enlarge)
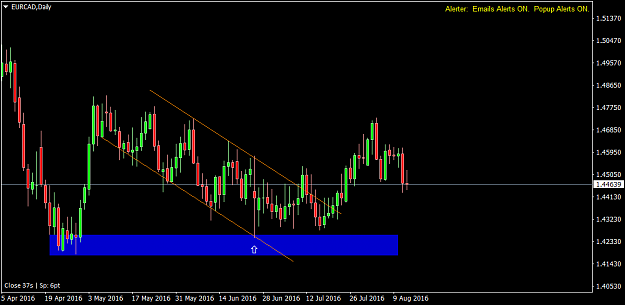
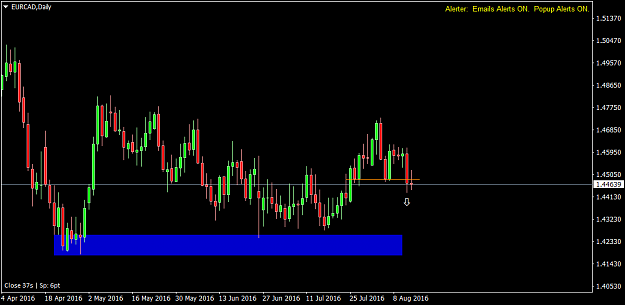
Cleaning up the chart and taking another view there is this:
2 x days ago, price closed cleanly below that support (there's a particular vernacular I use for the specifics of what I'm seeing/describing here but I will try and talk about this in another post. The main thing here is that, in accordance with SD basics, sellers were obviously in control):
Attached Image (click to enlarge)
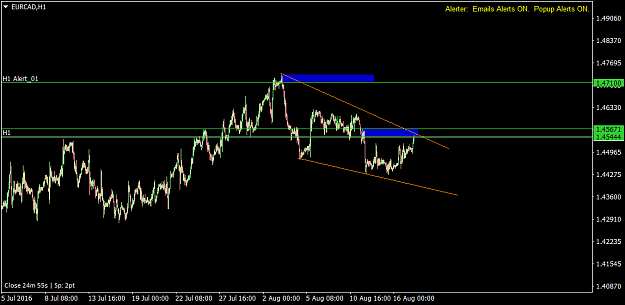
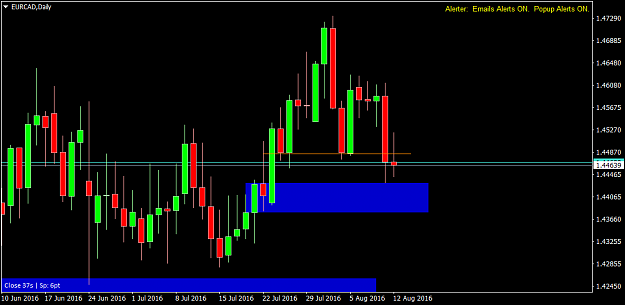
If we take a look at the third and final D1 chart we can see an area of demand. It looks like it's been tested but it hasn't:
Attached Image (click to enlarge)
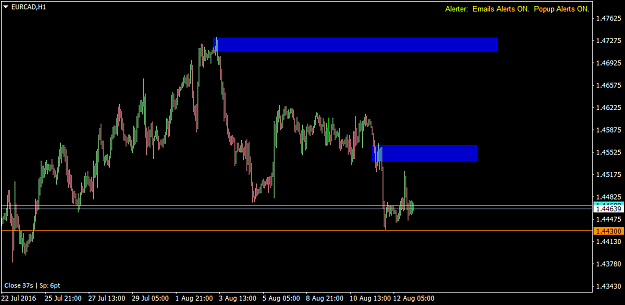
Drilling down to the H1 (and placing a yellow line where that demand is) we see the following:
Attached Image (click to enlarge)
At this point I (nor any other retail trader I might add) has a clue about whether or not price is going to test any of these levels.
But my side, I'll try and be there if, as and when it does, and play the situation accordingly (I would add here that the way
I trade the market is by reading PA once the level is tested - more on that in a later post).