FFF (ForexFactoryFriends), I couldnt trace the following bug or articles on the FFF (FF Forum);
In MT4 code I plot several graphical objects on the chart which sometimes behave unexpected.
Directly after the Start(); function the indicator checks whether a new bar is started, otherwise a Return(0) follows.
At certain new bars I plot graphical objects on the chart window, for instance the hour indication.
This should be done once and only at the 1st tick of the new bar.
After this tick the bar is started and in progress during the time frame period.
I use a well known NewBar function to detect a new bar, if (!bIsNewBar()) return(0);
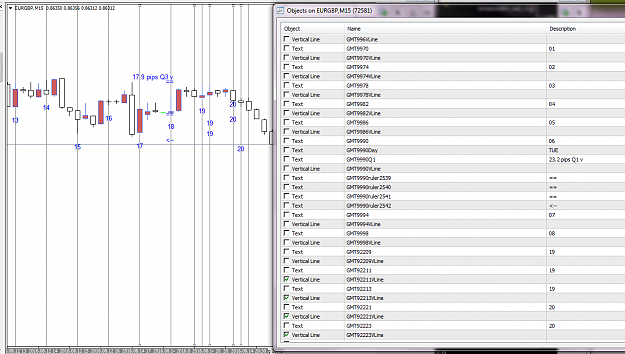
At initializing MetaTrader4 this works correctly for the whole history, but then during new formed bars the object is often plotted several times, almost on the same position and mostly slightly below each other, 2,3,4 times.
In a 3GL (3rd Generation Language like Fortran, C, Pascal, Cobol) this is impossible, it does what you program.
MT4 is a 3GL (C) with a 4GL overlay for a lot of Forex, time and graphical functions.
Is this a bug in my program or something in MT4 and to work around it ?
I suppose this problem is tackled several times, but I couldnt find a thread.
See a screenshot and my MT4 code example (which could be much shorter using iterations, but OK).
It plots vertical hour lines, hour values and at every quarter of a day == indications on 10-pip distances for this quarter and below <- for the remainer.
Here is where you'll find the unexpected extra plots.
Thanks for support, Ill close this thread with the correct solution and MT4 source code.
(My background is white, my toner supplier hates me. Always upload mt4 sources code in stead of ex4 only).
Cheers, cdeleeuw
In MT4 code I plot several graphical objects on the chart which sometimes behave unexpected.
Directly after the Start(); function the indicator checks whether a new bar is started, otherwise a Return(0) follows.
At certain new bars I plot graphical objects on the chart window, for instance the hour indication.
This should be done once and only at the 1st tick of the new bar.
After this tick the bar is started and in progress during the time frame period.
I use a well known NewBar function to detect a new bar, if (!bIsNewBar()) return(0);
At initializing MetaTrader4 this works correctly for the whole history, but then during new formed bars the object is often plotted several times, almost on the same position and mostly slightly below each other, 2,3,4 times.
In a 3GL (3rd Generation Language like Fortran, C, Pascal, Cobol) this is impossible, it does what you program.
MT4 is a 3GL (C) with a 4GL overlay for a lot of Forex, time and graphical functions.
Is this a bug in my program or something in MT4 and to work around it ?
I suppose this problem is tackled several times, but I couldnt find a thread.
See a screenshot and my MT4 code example (which could be much shorter using iterations, but OK).
It plots vertical hour lines, hour values and at every quarter of a day == indications on 10-pip distances for this quarter and below <- for the remainer.
Here is where you'll find the unexpected extra plots.
Thanks for support, Ill close this thread with the correct solution and MT4 source code.
(My background is white, my toner supplier hates me. Always upload mt4 sources code in stead of ex4 only).
Cheers, cdeleeuw
Attached Image (click to enlarge)
Attached File(s)