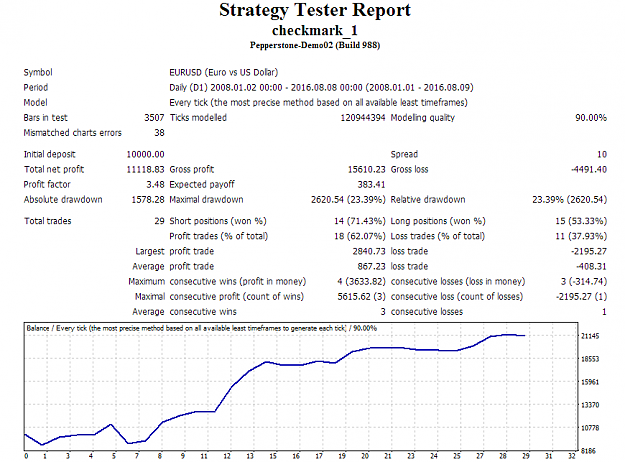
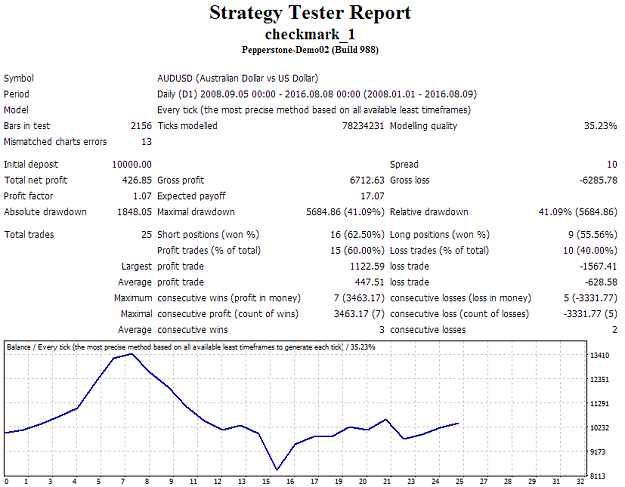
Hey all!
At first, I must apologise that my previous armageddon's thread was deleted. It was done for several reasons.
Now we start again but in a little bit different way.
The main philosophy of my system, of my trading technique is - PREDICTION AND TRADING ONE NEXT CANDLE AFTER THE SIGNAL.
System predicts not a how big or small will be next candle but a type of candle - bearish or bullish.
If we trade forex with this, we will not put SL and TP, we will open buy or sell when predicted candle opens and we will close order, when predicted candle closes. For all sceptics - EXACTLY ON THE SAME PRINCIPLE WORKS NEURAL NETWORKS. To trade successfull, profitable in a such a way - the percentage of right predicted candles must by at least 70 and working timeframe only H4 or D1.
If we trade binary options with this - it will be great. Probably, the best technique for binary options.
Let's start with rules and patterns.
At this moment I know 6 different graphic patterns which allows to predict next candle. We will start with first one and with a little moves will go to the next patterns. In all patterns we will need an indicator.
Let's go
I called it - CHECK MARK, because it looks like a

Rules for buy one candle
Pattern consist of 3 candles - in the middle there is a bullish candle, on the left and right bearish candles. Then we mark those 3 candles each other with a line which goes like line of close prices and we get a figure check mark. And stochastic in the same time must paint the same figure but in mirror way. When it is, after right bearish candle closes, we can buy one next candle because the signal ir telling us, that next candle will be bullish.

Rules for sell one candle
Pattern consist of 3 candles - in the middle there is a bearish candle, on the left and right bullish candles. Then we mark those 3 candles each other with a line which goes like line of close prices and we get a figure check mark. And stochastic in the same time must paint the same figure but in mirror way. When it is, after right bullish candle closes, we can sell one next candle because the signal ir telling us, that next candle will be bearish.

Working timeframe - H4, D1.
Stochastic parameters-
1) slowing=1
2) period D=1
3) Price field=high/low
4) Ma method=simple
5) K period= from 1 to 13
Stochastic is not the only one indicator where you can find this pattern. I will give you which indicators you can use as well.
Momentum - with period 1, apply to weighted close
RSI - with period 2, apply to weighted close
OBV - apply to weighted close
Accumulation/Distribution
At first, I must apologise that my previous armageddon's thread was deleted. It was done for several reasons.
Now we start again but in a little bit different way.
The main philosophy of my system, of my trading technique is - PREDICTION AND TRADING ONE NEXT CANDLE AFTER THE SIGNAL.
System predicts not a how big or small will be next candle but a type of candle - bearish or bullish.
If we trade forex with this, we will not put SL and TP, we will open buy or sell when predicted candle opens and we will close order, when predicted candle closes. For all sceptics - EXACTLY ON THE SAME PRINCIPLE WORKS NEURAL NETWORKS. To trade successfull, profitable in a such a way - the percentage of right predicted candles must by at least 70 and working timeframe only H4 or D1.
If we trade binary options with this - it will be great. Probably, the best technique for binary options.
Let's start with rules and patterns.
At this moment I know 6 different graphic patterns which allows to predict next candle. We will start with first one and with a little moves will go to the next patterns. In all patterns we will need an indicator.
Let's go
FIRST PATTERN
I called it - CHECK MARK, because it looks like a
Attached Image

Rules for buy one candle
Pattern consist of 3 candles - in the middle there is a bullish candle, on the left and right bearish candles. Then we mark those 3 candles each other with a line which goes like line of close prices and we get a figure check mark. And stochastic in the same time must paint the same figure but in mirror way. When it is, after right bearish candle closes, we can buy one next candle because the signal ir telling us, that next candle will be bullish.
Attached Image

Rules for sell one candle
Pattern consist of 3 candles - in the middle there is a bearish candle, on the left and right bullish candles. Then we mark those 3 candles each other with a line which goes like line of close prices and we get a figure check mark. And stochastic in the same time must paint the same figure but in mirror way. When it is, after right bullish candle closes, we can sell one next candle because the signal ir telling us, that next candle will be bearish.
Attached Image

Working timeframe - H4, D1.
Stochastic parameters-
1) slowing=1
2) period D=1
3) Price field=high/low
4) Ma method=simple
5) K period= from 1 to 13
Stochastic is not the only one indicator where you can find this pattern. I will give you which indicators you can use as well.
Momentum - with period 1, apply to weighted close
RSI - with period 2, apply to weighted close
OBV - apply to weighted close
Accumulation/Distribution


