Takes a few YEARS but either lose all ya money/make close to nothing watching crap or start working hard now and in a few years be making ridiculous money.
Tip 1: get rid of trendlines, fibs stochs, tdi, cpi whatever other retail crap, then Go and learn all about Market profile/Volume.
Tip 2: do not trade news trade its sentiment. Learn more about economy. What markets influence your market. Trade 1 market. Theyre all connected know 1 100%
Tip 3: after learning volume/Value start watching/trading demo on 5m and 1m charts
Tip 4: Strategy will become clear after learning value, and only after a year of profits intraday trading SMALL account do you trade serious money.
Thats all I can say. Theres a lot of work ahead no one can do it for you. No auto trader can do it for you. Trading rules havent changed since the dawn of time. Its buying v selling. Banks dont use algos 24/5 ffs. Peple dont want to do the work and it angers me because forex is the biggest scam and only idiot gamblers trade forex so the public think. Meaning thats what people think of me. Wake up people.
{quote} I do, I made over a dozen trades this week on AUDUSD.
Ignored
Ok, im not being a smartass here but howd you go? Why did you take trades? Macd crossover, fib 61.8? Oversold? Where was your stop loss what was you risk behind? Geniunely would like to know. How many times your risk did you achieve?
{quote} Ok, im not being a smartass here but howd you go? Why did you take trades? Macd crossover, fib 61.8? Oversold? Where was your stop loss what was you risk behind? Geniunely would like to know. How many times your risk did you achieve?
Ignored
I don't really have any of that info recorded in a spreadsheet or anything. I make trades based on my charts, usually using simple things like trends, momentum, supply/demand zones.
{quote} I don't really have any of that info recorded in a spreadsheet or anything. I make trades based on my charts, usually using simple things like trends, momentum, supply/demand zones.
Ignored
Its good you look at ds zones. But momentum and trends, the problem with those is that you dont know if they are strong or weak, So many times when youve sold a supply zone and it hasnt gone then taken you out its because you didnt realise the strength demand coming at you. Same with trends. Trends can be many things. Not simply just strong demand supply.
Need to be accross many things to know this, otherwise its just gamblng. Imo atm you should trade ds zones ONLY and if it doesnt go quickly your way cut it/get break even and try another zone. Do not trade trendlines or fibs or stochs just zones. Should cut down your losses get you on side at least.
{quote} Its good you look at ds zones. But momentum and trends, the problem with those is that you dont know if they are strong or weak, So many times when youve sold a supply zone and it hasnt gone then taken you out its because you didnt realise the strength demand coming at you. Same with trends. Trends can be many things. Not simply just strong demand supply. Need to be accross many things to know this, otherwise its just gamblng. Imo atm you should trade ds zones ONLY and if it doesnt go quickly your way cut it/get break even and try another...
Ignored
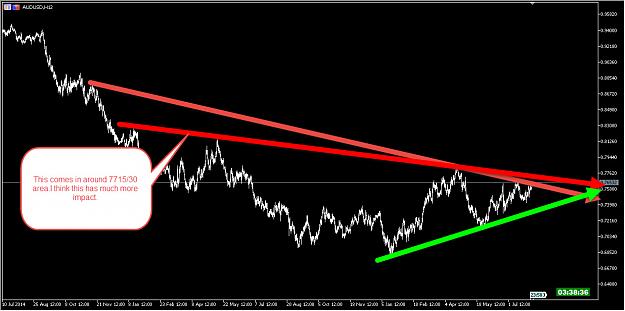
I am watching for a possible reversal around 7680. Sent you a PM
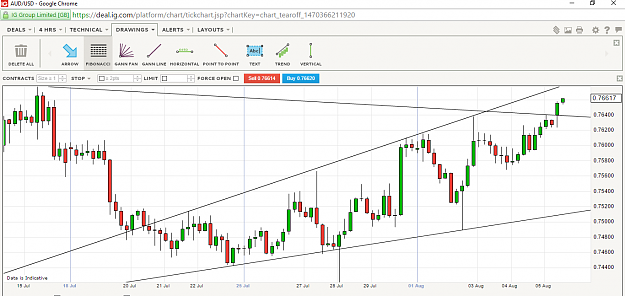
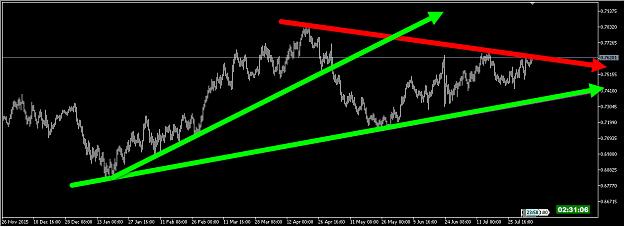
{quote} AU already break above upper TL, not a good sign for bears. i won't short AU unless it's back below upper TL.
Ignored
Your upper TL only runs across 2 closely spaced points on the left, then through a spike on the right to touch current price? There are lots of ways to make TLs look different. Here's another 4 HR possibility across more highs. Not saying mine is necessarily better, but yours doesn't include much data or have a real link on the right hand side.
{quote} Your upper TL only runs across 2 closely spaced points on the left, then through a spike on the right to touch current price? There are lots of ways to make TLs look different. Here's another 4 HR possibility across more highs. Not saying mine is necessarily better, but yours doesn't include much data or have a real link on the right hand side. {image}
Ignored
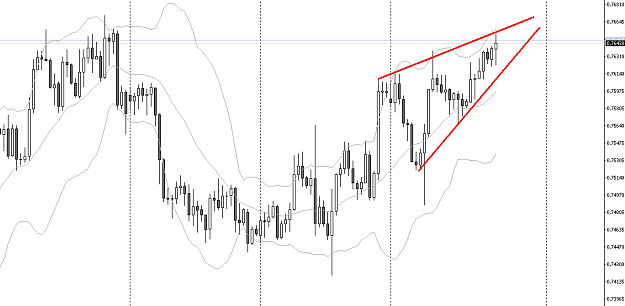
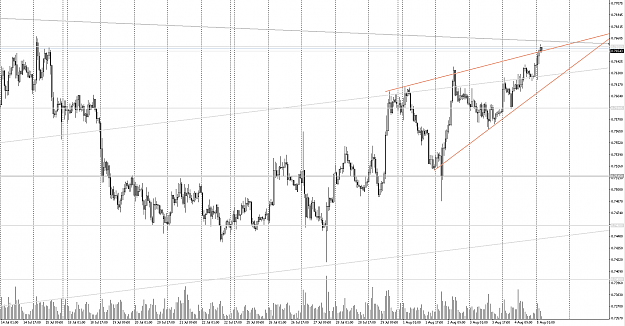
That wedge could be last attempt to stop AU bulls ... this is just my opinion, could be wrong though.
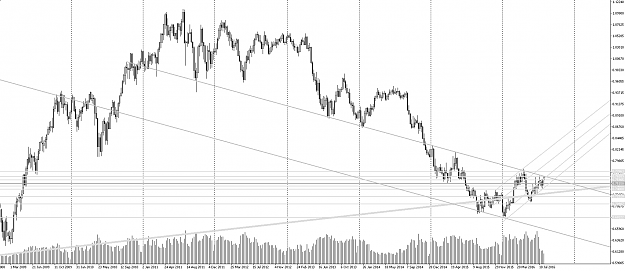
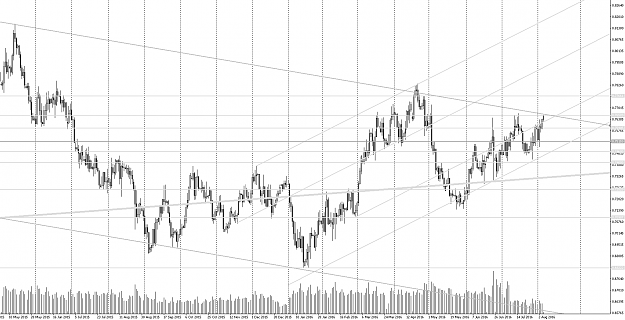
{quote} That wedge could be last attempt to stop AU bulls ... this is just my opinion, could be wrong though. here is my chart, Weekly {image} Daily {image}
Hi Paul... may i please know of your expected time frame that it will TP at 72s? A month/week? Pwetty pwease...
Ignored
My tp on this trade was at .75750 so I dont know where you got ,72 from.
I left it running last night and not at the pc until now. Looked like a good entry but sometimes you get it wrong I should of stuck to my plan and wait until it reaches .78 before shorting again.
never mind.
What I have to say is MM is money is more important than entry.
Upside to the AUD is limited.
Almost 3 weeks ago about 30,000 long were added these longs may be lucky to have made it in the green zone. So it wouldn't surprise me once in the green they cut longs and go short. We wont know this until either its starts falling, or next Friday a week from now when cot is released.
I use the calender on ff
Came on here as I had a look and people were selling and I see why (supply zone, downtrend) but banks/Instos do this to accumulate.
Just occured to me weare nearing or at macro supply zone. What I want to add is that before bexit/cuts in may aussie was bound for 82c. Not sure atm, but if not rejection here 82c here we come. Would be amazing considering cuts but usd dollar weakness, and possibly tuen around in oil etc it could happen. Stop looking for sells and wait until rejection or go and learn more about intraday trading. I would not be selling yet. No way. Must hit 77c at least now. Of course if you want to sell and be scalping and doing one pip orderflow ninja stuff lol sure go for it but remember youll be doing it very dangerously with no strength behind you.
{quote} That wedge could be last attempt to stop AU bulls ... this is just my opinion, could be wrong though. here is my chart, Weekly {image} Daily {image}