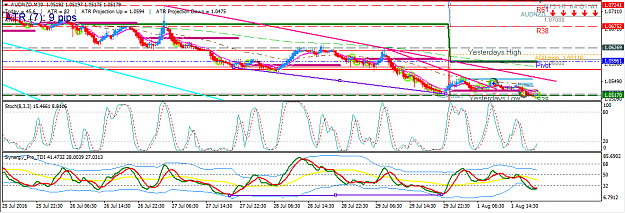
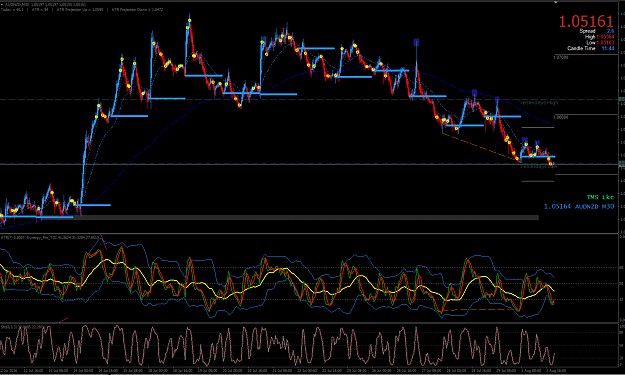
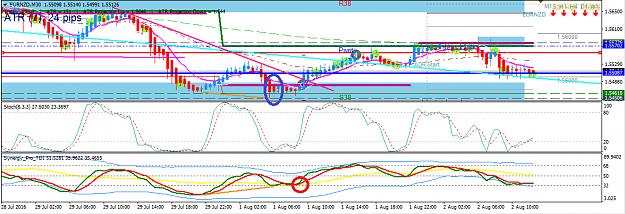
Disliked{quote} I see the following TDI green and stochi heading down at your entry 50 ema directly above Support where you marked High Also how many weekly pivot indicators do you needIgnored
hi Lookleft,
At my entry i entered the bar after the the big blue one and the big blue one was a bounce trade and good angle on tdi, I entered on the retrace as I would be able to get my RR of 1: 1.5 then. by time the retrace was in effect the tdi was sloping down ...but i don't see what is wrong with waiting for a retrace to enter as everyone does it time to time.
Also I did not take note of the 50 ema because I never see likica mention it. I see her mention the 200 ema a lot but never the 50 ..so I don't really use it for support/resistance. tbh, i don't really use it at all.
About the support, [did you mean resistance?] I did not class it as a resistance ..because I only really see likica use diagonal resistance and there is no other swing level connecting to that resistance either, in the past where i used to catogorise every little peak or place price stopped as resistance my charts looked like railroad tracks with a few pips inbetween each level. I also see likica will sometimes trade past these peaks, Perhaps though I am wrong on this and you are right. Would love it if likica could come in and try and clear up the confusion.
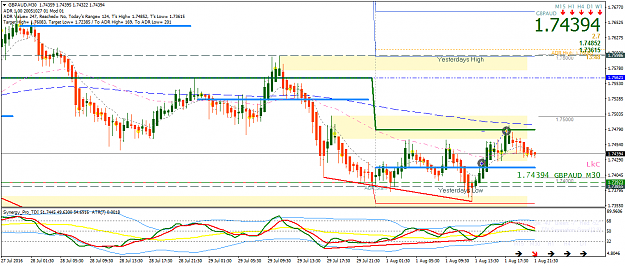
and about the pivot indicators.
blame Likica!
This is her template with a few minor alterations ....and BOTH those pivot indicators were her doing
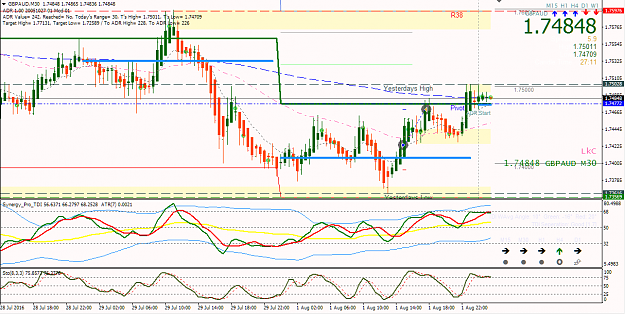
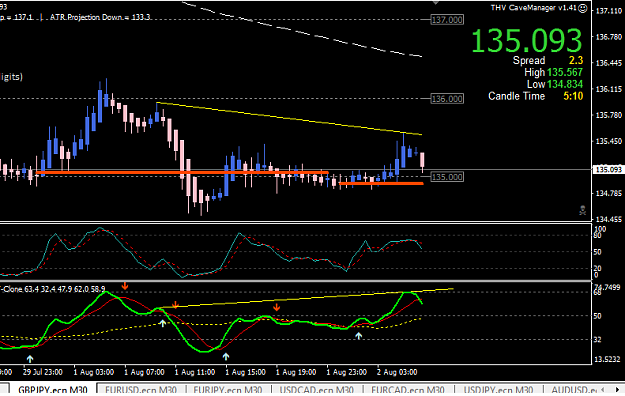
lisat i have drawn in the divergance now.
it is only a slight divergance, but on my charts the swing on the right of the tdi is lower than the swing on the left slightly
