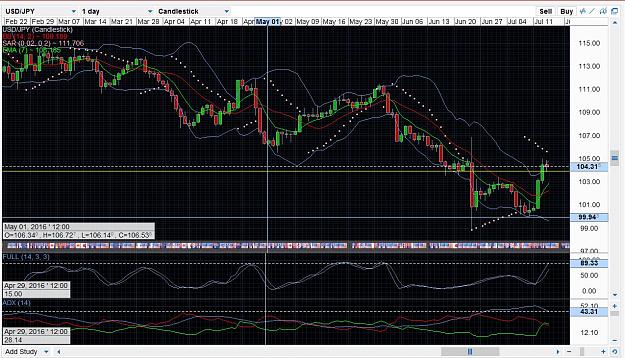
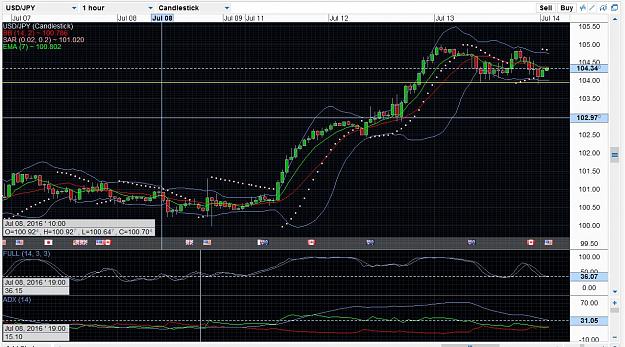
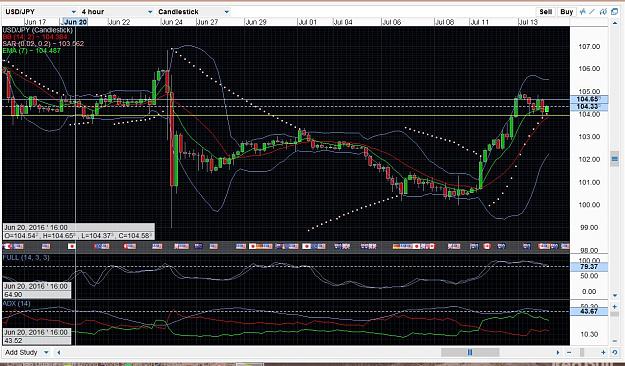
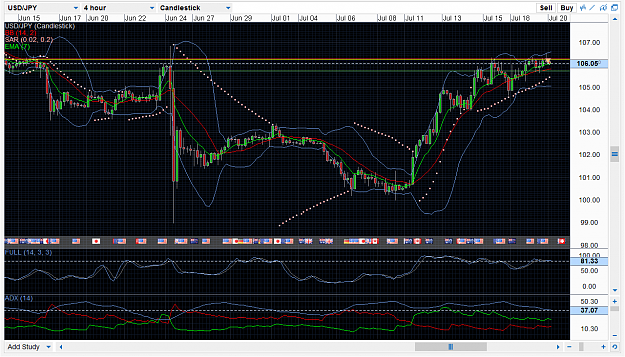
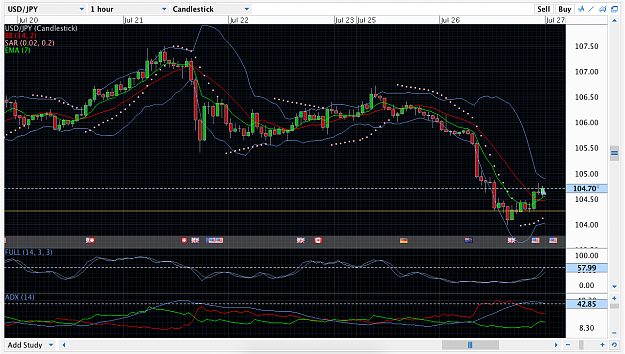
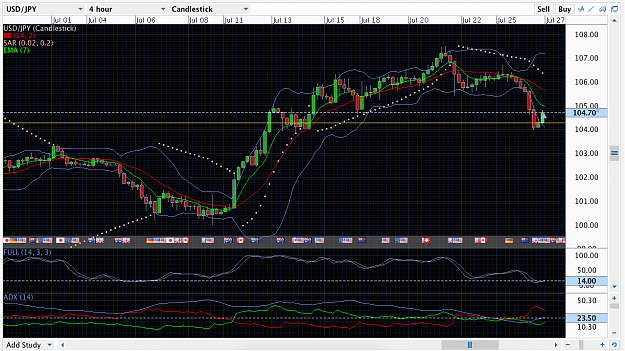
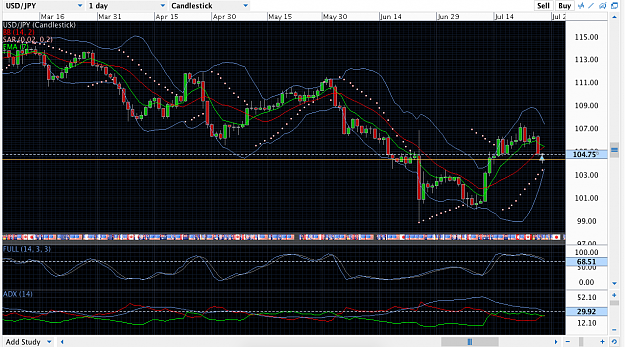
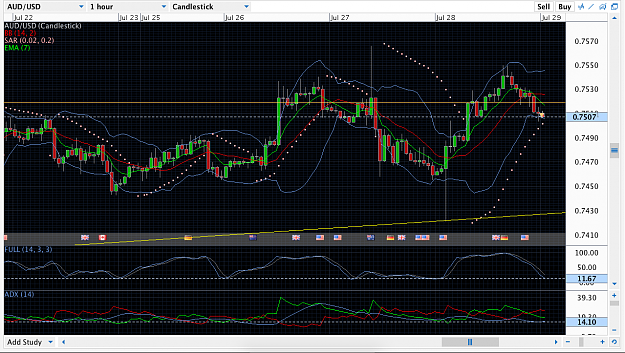
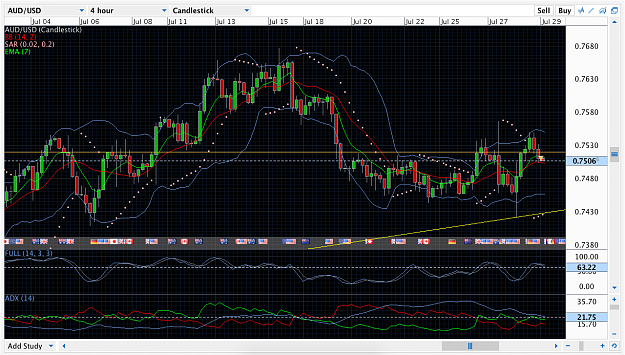
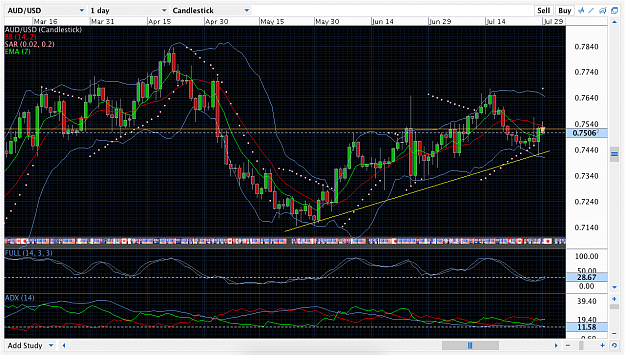
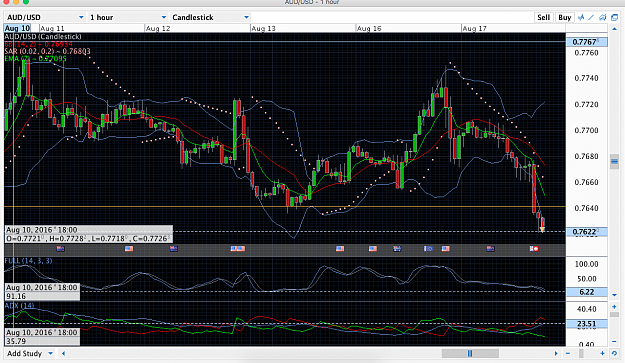
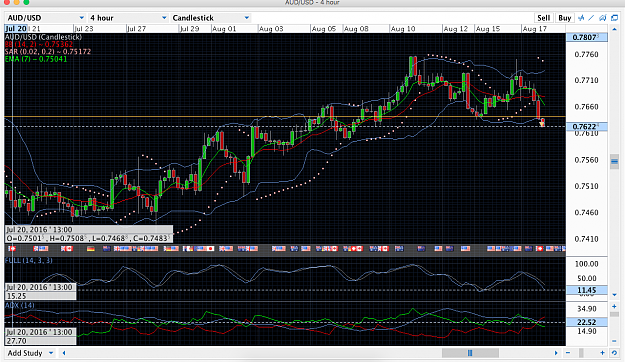
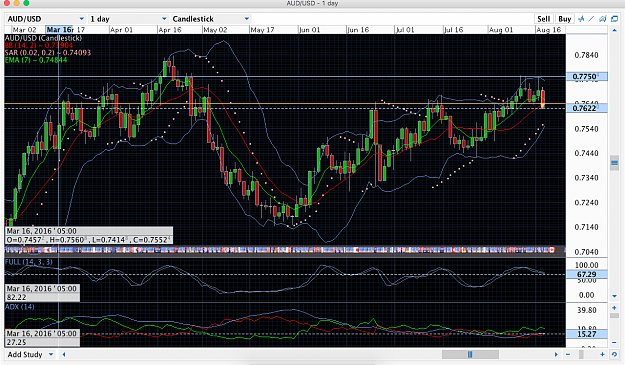
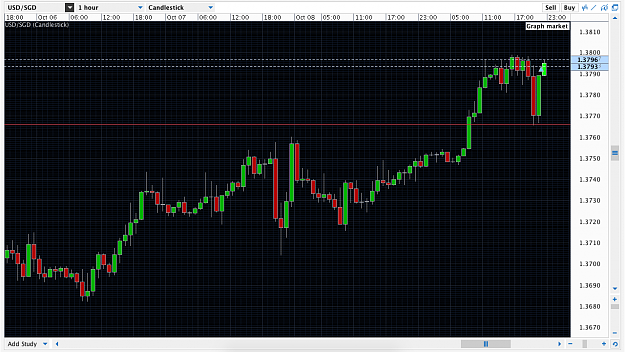
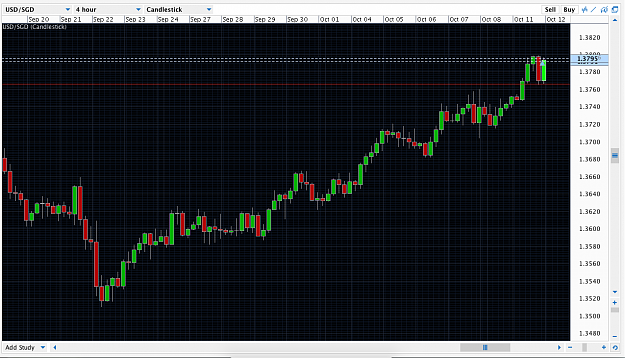
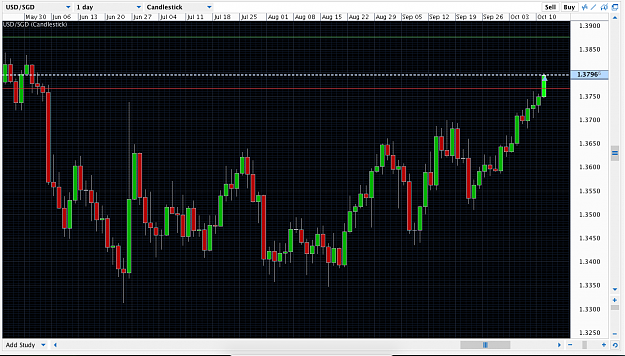
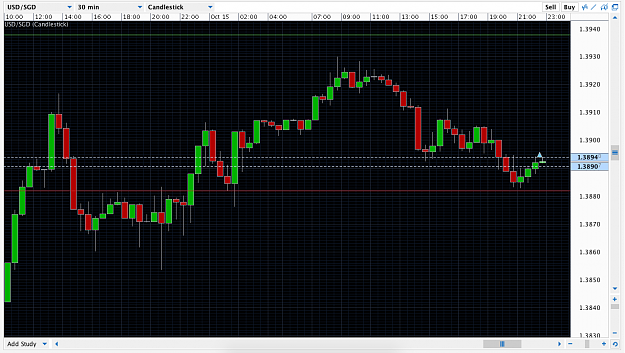
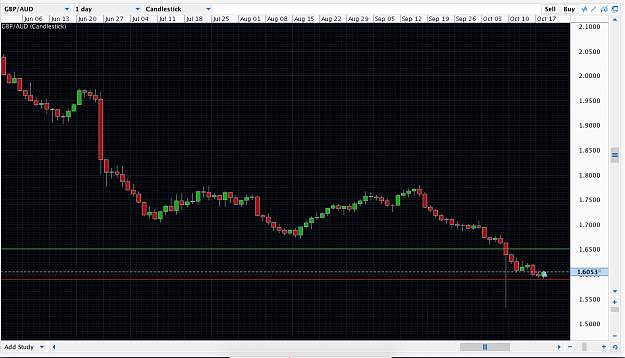
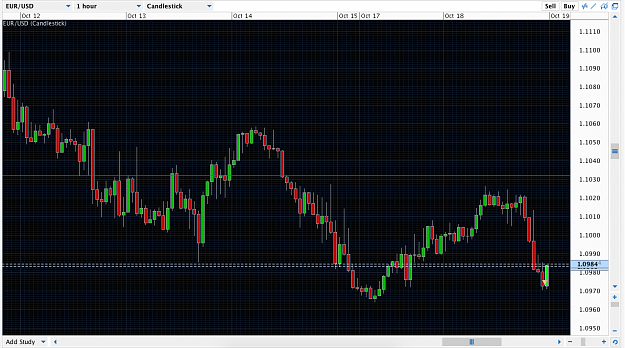
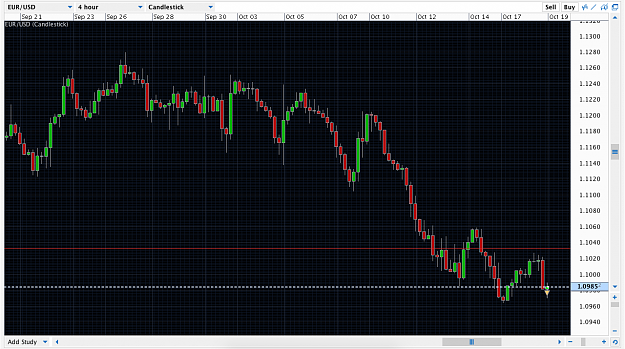
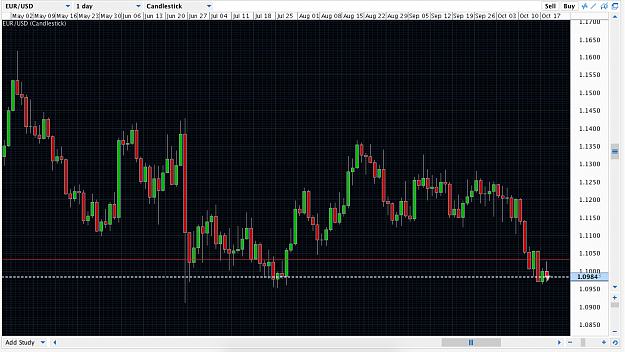
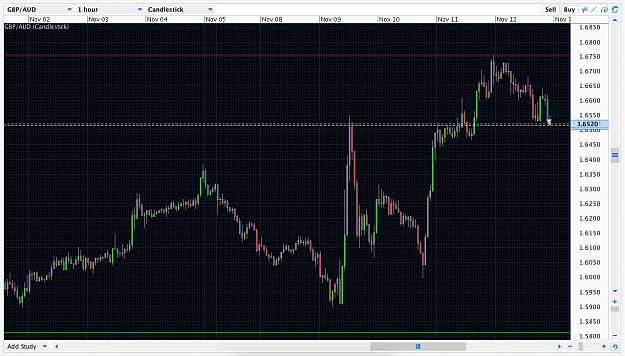
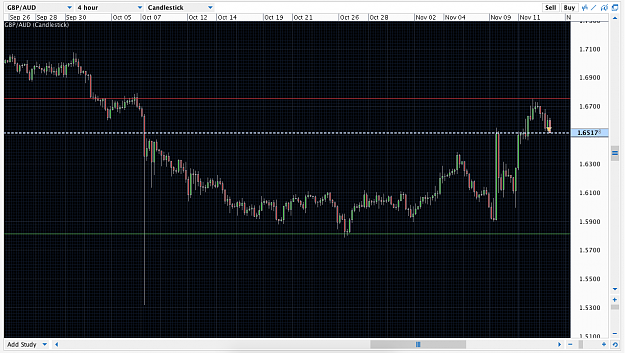
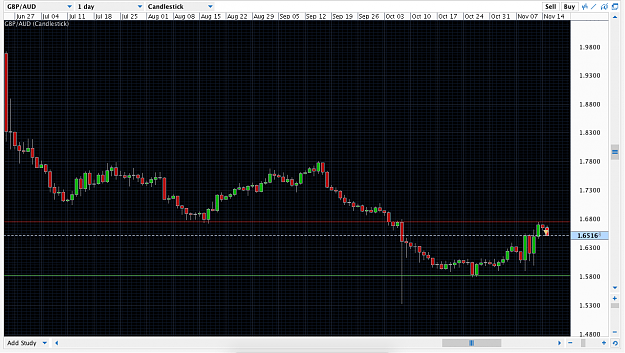
• Home
  • Forums
  • Trades
  • News
  • Calendar
  • Market
  • Brokers
  • Login
  • Join
  • User/Email: Password:
  • 3:16am
Menu
  • Forums
  • Trades
  • News
  • Calendar
  • Market
  • Brokers
  • Login
  • Join
  • 3:16am
Sister Sites
  • Metals Mine
  • Energy EXCH
  • Crypto Craft

Options

Bookmark Thread

First Page First Unread Last Page Last Post

Print Thread

Similar Threads

Baby's 5 min system Trading Journal 3 replies

Baby Sitter EA 4 replies

Baby Steps... 6 replies

FX Baby Trading Journal 0 replies

  • Trading Journals
  • /
  • Reply to Thread
  • Subscribe
  • 64
Attachments: My Baby Squirtle
Exit Attachments
Tags: My Baby Squirtle
Cancel

My Baby Squirtle

  • Last Post
  •  
  • 1 Page 2 3
  • 1 Page 2 3
  •  
  • Post #21
  • Quote
  • Jul 13, 2016 1:20pm Jul 13, 2016 1:20pm
  •  bryan9725
  • | Joined Sep 2015 | Status: Member | 60 Posts
Quoting bryan9725
Disliked
This trade is almost completely in sync with my strategy. The only thing is that in the short term frame (1 hr), there wasn't really a strong trend and in the main frame, Stochastic levels were low, but not low enough to hit 20.. Other than that, I think that all the conditions were perfect for a short trade. The large time frame (1 day) is strongly trending in an extremely oversold condition while the main time frame is also strongly trending in a mildly oversold condition. The small time frame is mildly trending in an increasingly oversold condition....
Ignored
This trade turned out to be a huge loss of 110 Pips. I wasn't really sure why because most of the indicators were perfect. I will keep testing this strategy out and see if it's this trade or its the strategy.
Bryan | Bryanpreneurship
 
 
  • Post #22
  • Quote
  • Jul 13, 2016 1:24pm Jul 13, 2016 1:24pm
  •  bryan9725
  • | Joined Sep 2015 | Status: Member | 60 Posts
Prices have been trending strongly for quite a while now for this pair and I think that the recent bear is merely a retracement and prices will continue bulling for the next few periods. One of the reasons why I think it is a retracement is because of a support level found in the 1 Hour chart. So if I were to make a trade on this pair, it would be to go bull.
Attached Image(s) (click to enlarge)
Click to Enlarge

Name: 1day.JPG
Size: 257 KB
Click to Enlarge

Name: 1hr.JPG
Size: 234 KB
Click to Enlarge

Name: 4hr.JPG
Size: 252 KB
Bryan | Bryanpreneurship
 
 
  • Post #23
  • Quote
  • Jul 19, 2016 12:36pm Jul 19, 2016 12:36pm
  •  bryan9725
  • | Joined Sep 2015 | Status: Member | 60 Posts
I took a shot at this because I saw that prices are currently at the resistance level from a month ago. Over the past few days, the prices have tried several times but failed to breakthrough the resistance. Furthermore in the hourly chart, prices are currently trading in range near it's peak level. So with all this, I went short.
Attached Image(s) (click to enlarge)
Click to Enlarge

Name: 1Hr.PNG
Size: 87 KB
Click to Enlarge

Name: 4Hr.PNG
Size: 94 KB
Bryan | Bryanpreneurship
 
 
  • Post #24
  • Quote
  • Jul 19, 2016 12:51pm Jul 19, 2016 12:51pm
  •  Pipslam
  • | Joined Oct 2015 | Status: Member | 21 Posts
bryan.. great thread I would strongly recommend studying price action.

I use to trade a similar method that you are currently using and i have now switched to price action and life is much easier

I have a total of 3 horizontal lines on my charts ( tops!) and two ema's.... very clean

strictly trading the break outs of levels, feel free to pm me and I can give you some more info if you want, i can also recommend a few course's if you want ( no im not selling anything )
 
 
  • Post #25
  • Quote
  • Jul 26, 2016 11:50am Jul 26, 2016 11:50am
  •  bryan9725
  • | Joined Sep 2015 | Status: Member | 60 Posts
I made this trade because I think that prices will temporarily retrace from bears to a bull. If there was a trend in this chart right now, it would be a bearish trend. But the most recent prices suggests that prices are either in a retracement or a reversal. I am guessing that prices are in a retracement since the daily charts suggests that prices are being bearish.
Attached Image(s) (click to enlarge)
Click to Enlarge

Name: Screen Shot 2016-07-26 at 11.45.41 PM.png
Size: 119 KB
Click to Enlarge

Name: Screen Shot 2016-07-26 at 11.46.00 PM.png
Size: 127 KB
Click to Enlarge

Name: Screen Shot 2016-07-26 at 11.49.03 PM.png
Size: 138 KB
Bryan | Bryanpreneurship
 
 
  • Post #26
  • Quote
  • Jul 26, 2016 11:51am Jul 26, 2016 11:51am
  •  bryan9725
  • | Joined Sep 2015 | Status: Member | 60 Posts
I have decided to stop using the strategy that I developed a while earlier because I realised that I was too ambitious in my strategy. I was looking for huge trends to happen everyday. To be honest, I don't know what I want. Do I want to trade huge trends or do I want to trade smaller price actions. I need to think about which one suits me most.
Bryan | Bryanpreneurship
 
 
  • Post #27
  • Quote
  • Jul 28, 2016 12:30pm Jul 28, 2016 12:30pm
  •  bryan9725
  • | Joined Sep 2015 | Status: Member | 60 Posts
Short on AUD/USD

Based on my observation, prices overall are currently in a bullish trend. I know this because in the daily chart, there is an elevated support line that continuously pushes prices up. However, this trade was not about the overall trend but rather on a retracement as seen in the 4Hr and 1Hr chart. When I made this trade, I am betting that prices will go into a retracement if not reversal before it continues in it's dominant direction.
Attached Image(s) (click to enlarge)
Click to Enlarge

Name: Screen Shot 2016-07-29 at 12.23.15 AM.png
Size: 129 KB
Click to Enlarge

Name: Screen Shot 2016-07-29 at 12.23.24 AM.png
Size: 136 KB
Click to Enlarge

Name: Screen Shot 2016-07-29 at 12.23.34 AM.png
Size: 149 KB
Bryan | Bryanpreneurship
 
 
  • Post #28
  • Quote
  • Jul 28, 2016 12:30pm Jul 28, 2016 12:30pm
  •  bryan9725
  • | Joined Sep 2015 | Status: Member | 60 Posts
Prices over here looks like they are about to breakout. Certainly worth looking at tomorrow.
Attached Image (click to enlarge)
Click to Enlarge

Name: Prices looks like they are about to breakout soon.png
Size: 138 KB
Bryan | Bryanpreneurship
 
 
  • Post #29
  • Quote
  • Jul 28, 2016 12:32pm Jul 28, 2016 12:32pm
  •  bryan9725
  • | Joined Sep 2015 | Status: Member | 60 Posts
Quoting bryan9725
Disliked
I made this trade because I think that prices will temporarily retrace from bears to a bull. If there was a trend in this chart right now, it would be a bearish trend. But the most recent prices suggests that prices are either in a retracement or a reversal. I am guessing that prices are in a retracement since the daily charts suggests that prices are being bearish. {image} {image} {image}
Ignored
I was right on this trade and prices did indeed go into a retracement. I was quite happy because it has really been a long time since I won even once. I know I will most likely continue to lose more than I win but this is definitely a very good encouragement. I managed to win 140 Pips
Bryan | Bryanpreneurship
 
 
  • Post #30
  • Quote
  • Aug 17, 2016 6:32am Aug 17, 2016 6:32am
  •  bryan9725
  • | Joined Sep 2015 | Status: Member | 60 Posts
Every timeframe I looked, prices are going down. And after observing the 4 hour chart, this down trend or reversal has just started and I am definitely eager to ride this wave.
Attached Image(s) (click to enlarge)
Click to Enlarge

Name: Screen Shot 2016-08-17 at 6.30.36 PM.png
Size: 151 KB
Click to Enlarge

Name: Screen Shot 2016-08-17 at 6.30.43 PM.png
Size: 159 KB
Click to Enlarge

Name: Screen Shot 2016-08-17 at 6.30.52 PM.png
Size: 174 KB
Bryan | Bryanpreneurship
 
 
  • Post #31
  • Quote
  • Aug 17, 2016 7:31am Aug 17, 2016 7:31am
  •  Lacunoide
  • | Joined Sep 2013 | Status: Member | 671 Posts
Did you backtest your strategy?... You are already down about 70%...


Creating a successful strategy can require years of hard work.. I have found the light at the tunnel with Automated trading...

I strongly suggest you to code your own strategy and make extensive backtesting. In this way you can achive better results because you have a range when you know you strategy will be profitable if you repeat it sooner or later you are going to have profits..

The key to success is diversification, because true profit are achived with diversification, because different pairs or assets move differenly even if you strategy does not perform great when combinate with a diverisficate portfolio the result are quite impressive.

When you fully understand this aspect you are going to see quite impressive results.

In fact, if you search for "Managed CTA" at this site http://www.managedfutures.com/top_cta_rankings.aspx

you can see the results of the professionals, The main thing you can notice is that they use a very large amount of different assets, up to 20-30 different assets.

They know that if they want to achive good results they need maximum diversification.

At the end of the day their strategy could be simple moving averages crossover, perhaps on the single asset the return are very low.. but when everything is combinate with diversification the music changes...

You can also see that these funds have relative large Drawdowns...

BUT on the long run they win... Because they use a strategy that they backtested and because they diversify their portfolio.
Buy at the Low, Sell at the High You make money by waiting not by trading.
 
 
  • Post #32
  • Quote
  • Sep 11, 2016 11:14pm Sep 11, 2016 11:14pm
  •  bryan9725
  • | Joined Sep 2015 | Status: Member | 60 Posts
I went short on this because I feel that prices on the big picture is still going down. And prices are also near a resistance level and has not broken out of it yet. I set the stop loss to be just above the resistance zone so that my trade will close if I am wrong.
Attached Image (click to enlarge)
Click to Enlarge

Name: Screen Shot 2016-09-12 at 11.09.17 AM.png
Size: 74 KB
Bryan | Bryanpreneurship
 
 
  • Post #33
  • Quote
  • Sep 12, 2016 9:13pm Sep 12, 2016 9:13pm
  •  bryan9725
  • | Joined Sep 2015 | Status: Member | 60 Posts
The last time around I made a loss and I accept it. It's part of my learning. Today I spotted another opportunity where the overall trend is bearish but there is a temporary retracement. I am once again entering a bargain trade where I am making a bargain on the cost of trade. Assuming that I am right that prices will continue going bearish.
Attached Image (click to enlarge)
Click to Enlarge

Name: Screen Shot 2016-09-13 at 9.10.45 AM.png
Size: 81 KB
Bryan | Bryanpreneurship
 
 
  • Post #34
  • Quote
  • Sep 26, 2016 7:23pm Sep 26, 2016 7:23pm
  •  bryan9725
  • | Joined Sep 2015 | Status: Member | 60 Posts
Based on my observation, I concluded that prices are in a resistance zone and the buyer power is weakening. This resistance zone has been successful in caging the price multiple times in the past and this trade is about betting that it will also cage the price this time. I took a short position using the hourly chart as my main reference.
Attached Image(s) (click to enlarge)
Click to Enlarge

Name: Screen Shot 2016-09-27 at 7.19.25 AM.png
Size: 98 KB
Click to Enlarge

Name: Screen Shot 2016-09-27 at 7.19.40 AM.png
Size: 110 KB
Click to Enlarge

Name: Screen Shot 2016-09-27 at 7.19.52 AM.png
Size: 112 KB
Bryan | Bryanpreneurship
 
 
  • Post #35
  • Quote
  • Oct 11, 2016 10:14am Oct 11, 2016 10:14am
  •  bryan9725
  • | Joined Sep 2015 | Status: Member | 60 Posts
I have identified this trade as a bargain trade. Meaning that I am entering a long position at a discount due to a retracement as seen in the hourly charts. Based on observing the daily and 4 hourly charts, I concluded that prices will continue to go up.
Attached Image(s) (click to enlarge)
Click to Enlarge

Name: Screen Shot 2016-10-11 at 10.11.14 PM.png
Size: 87 KB
Click to Enlarge

Name: Screen Shot 2016-10-11 at 10.12.08 PM.png
Size: 107 KB
Click to Enlarge

Name: Screen Shot 2016-10-11 at 10.12.17 PM.png
Size: 90 KB
Bryan | Bryanpreneurship
 
 
  • Post #36
  • Quote
  • Oct 17, 2016 10:38am Oct 17, 2016 10:38am
  •  bryan9725
  • | Joined Sep 2015 | Status: Member | 60 Posts
I have identified yet another bargain trade on this pair. Based on my analysis, prices have been steadily heading up over the past few trading days. And there isn't much reason to believe why it will suddenly reverse it's direction so I decided to take this bet that this is a bargain trade. However, despite that, I have cut myself quite short on this trade as the stop target is very close to my entry target.
Attached Image(s) (click to enlarge)
Click to Enlarge

Name: Screen Shot 2016-10-17 at 10.34.27 PM.png
Size: 79 KB
Click to Enlarge

Name: Screen Shot 2016-10-17 at 10.34.39 PM.png
Size: 101 KB
Click to Enlarge

Name: Screen Shot 2016-10-17 at 10.34.46 PM.png
Size: 107 KB
Bryan | Bryanpreneurship
 
 
  • Post #37
  • Quote
  • Oct 18, 2016 11:12am Oct 18, 2016 11:12am
  •  bryan9725
  • | Joined Sep 2015 | Status: Member | 60 Posts
I am taking quite a risk with this one considering the Brexit thing. But as I have seen prices steadily growing and forming a support line, I have decided to go long on this trade with my SL just under the support line.

SL: 1.5900
TP: 1.6514
Attached Image(s) (click to enlarge)
Click to Enlarge

Name: Screen Shot 2016-10-18 at 11.07.00 PM.png
Size: 75 KB
Click to Enlarge

Name: Screen Shot 2016-10-18 at 11.07.06 PM.png
Size: 77 KB
Click to Enlarge

Name: Screen Shot 2016-10-18 at 11.07.17 PM.png
Size: 77 KB
Bryan | Bryanpreneurship
 
 
  • Post #38
  • Quote
  • Oct 18, 2016 11:15am Oct 18, 2016 11:15am
  •  bryan9725
  • | Joined Sep 2015 | Status: Member | 60 Posts
SL: 1.1032
TP: 1.0796

Prices on the longer timeframe has been steadily going bearish with the recent few days of disruptions. I have made a bearish trade with this pair and placed my stop loss just above the resistance zone.
Attached Image(s) (click to enlarge)
Click to Enlarge

Name: Screen Shot 2016-10-18 at 11.13.10 PM.png
Size: 88 KB
Click to Enlarge

Name: Screen Shot 2016-10-18 at 11.13.20 PM.png
Size: 103 KB
Click to Enlarge

Name: Screen Shot 2016-10-18 at 11.13.28 PM.png
Size: 97 KB
Bryan | Bryanpreneurship
 
 
  • Post #39
  • Quote
  • Nov 14, 2016 9:14am Nov 14, 2016 9:14am
  •  bryan9725
  • | Joined Sep 2015 | Status: Member | 60 Posts

  1. Currency pair : GBPAUD
  2. Position : Short
  3. Opening Price : 1.65190
  4. TP : 1.58137
  5. SL : 1.67541
  6. Rationale for making this trade based on my strategy : The daily chart revealed a slowing down bullish trend and signs of a drawback. These moves have been further confirmed within the 4-hr and 1-hr chart as they were all also showing drawback movements. Stop loss was placed a the resistance level.
  7. Screenshots of all 3 timeframes (1 day, 4 hour, 1 hour)

Attached Image(s) (click to enlarge)
Click to Enlarge

Name: Screen Shot 2016-11-14 at 10.06.30 PM.png
Size: 102 KB
Click to Enlarge

Name: Screen Shot 2016-11-14 at 10.06.48 PM.png
Size: 82 KB
Click to Enlarge

Name: Screen Shot 2016-11-14 at 10.07.03 PM.png
Size: 78 KB
Bryan | Bryanpreneurship
 
 
  • Post #40
  • Quote
  • Nov 15, 2016 9:59pm Nov 15, 2016 9:59pm
  •  StraticLine
  • | Joined Nov 2016 | Status: Member | 13 Posts
Very nice 3 time frame analysis.
How long do you want to hold this trade?
 
 
  • Trading Journals
  • /
  • My Baby Squirtle
  • Reply to Thread
    • 1 Page 2 3
    • 1 Page 2 3
0 traders viewing now
  • More
Top of Page
  • Facebook
  • Twitter
About FF
  • Mission
  • Products
  • User Guide
  • Media Kit
  • Blog
  • Contact
FF Products
  • Forums
  • Trades
  • Calendar
  • News
  • Market
  • Brokers
  • Trade Explorer
FF Website
  • Homepage
  • Search
  • Members
  • Report a Bug
Follow FF
  • Facebook
  • Twitter

FF Sister Sites:

  • Metals Mine
  • Energy EXCH
  • Crypto Craft

Forex Factory® is a brand of Fair Economy, Inc.

Terms of Service / ©2023