• Home
  • Forums
  • Trades
  • News
  • Calendar
  • Market
  • Brokers
  • Login
  • Join
  • User/Email: Password:
  • 3:13am
Menu
  • Forums
  • Trades
  • News
  • Calendar
  • Market
  • Brokers
  • Login
  • Join
  • 3:13am
Sister Sites
  • Metals Mine
  • Energy EXCH
  • Crypto Craft

Options

Bookmark Thread

First Page First Unread Last Page Last Post

Print Thread

Similar Threads

Baby's 5 min system Trading Journal 3 replies

Baby Sitter EA 4 replies

Baby Steps... 6 replies

FX Baby Trading Journal 0 replies

  • Trading Journals
  • /
  • Reply to Thread
  • Subscribe
  • 64
Attachments: My Baby Squirtle
Exit Attachments
Tags: My Baby Squirtle
Cancel

My Baby Squirtle

  • Last Post
  •  
  • Page 1 2 3
  • Page 1 2 3
  •  
  • Post #1
  • Quote
  • First Post: May 15, 2016 12:20am May 15, 2016 12:20am
  •  bryan9725
  • | Joined Sep 2015 | Status: Member | 60 Posts
Hi all,

This is my very first post in the thread. This is the very thread that will be used to document all my trades. Since I am still a beginner, this thread is called baby Squirtle. When I feel that I have hit the intermediate stage, I will rename this into Wartortle. And when I am in the advanced stage, this thread will be called Blastoise.
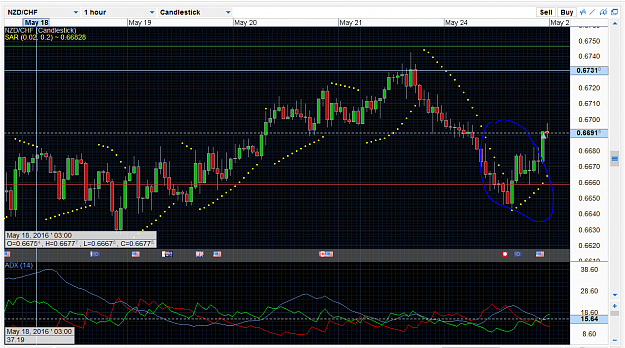
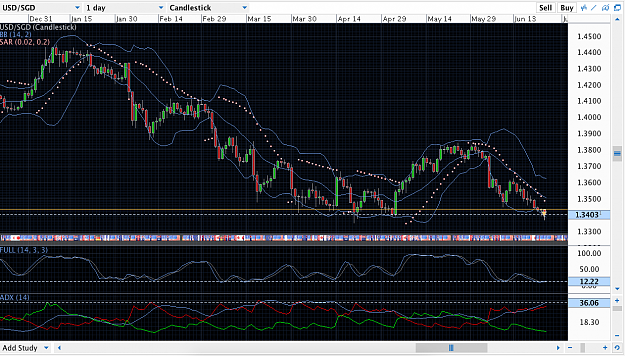
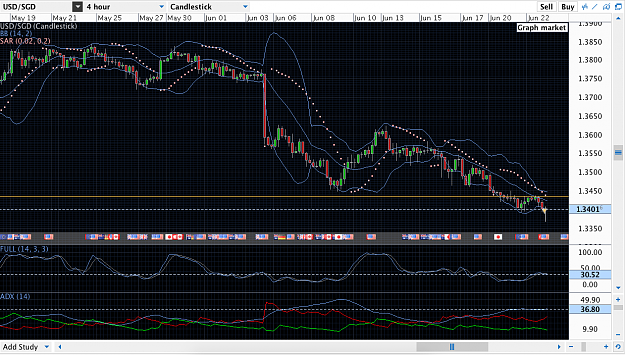
Attached Image
Bryan | Bryanpreneurship
  • Post #2
  • Quote
  • May 15, 2016 12:36am May 15, 2016 12:36am
  •  bryan9725
  • | Joined Sep 2015 | Status: Member | 60 Posts
What should a solid trading plan be made of:


  1. Amount of starting capital to be used for trading
  2. Primary lot size and leverage used
  3. Maximum percentage of trading capital risked on each trade
  4. Reward-to-risk ratio target
  5. Realistic daily, weekly and monthly profit goals.
  6. Specific daily, weekly, and monthly loss limits (the point of monetary loss at which a trader stops trading for the given period)
  7. An entire description of the trading strategy(s) used
  8. Specific trade entry criteria according to the tested trading strategy
  9. Specific trade exit criteria (stop losses, profit limits, and/or manual exits) according to the tested trading strategy.

These are the things I must have when I am formulating my own strategy.

Bryan | Bryanpreneurship
 
 
  • Post #3
  • Quote
  • May 15, 2016 4:06pm May 15, 2016 4:06pm
  •  jpch89
  • | Joined Apr 2014 | Status: Still far from profitable ... | 54 Posts
Hi bryan.
Cute pokemon!
It reminds me of my childhood.
I personally like this one.
Don't know its English name though.
Attached Image

Trading is an adventure, sometimes the road is bumpy, but we have to keep going.
I wish you success.
 
 
  • Post #4
  • Quote
  • May 24, 2016 10:54am May 24, 2016 10:54am
  •  bryan9725
  • | Joined Sep 2015 | Status: Member | 60 Posts
Both 4 Hour and 1 Hour char seemed to be recovering from a pull-back and heading bull. The ADX (14) indicator said that in the daily time frame, prices are quite stagnant and not really trending in any directions. Anyway, I just opened a Long for this currency pair
Attached Image (click to enlarge)
Click to Enlarge

Name: Screenshot1.png
Size: 99 KB

Attached Image (click to enlarge)
Click to Enlarge

Name: Screenshot2.png
Size: 104 KB
Bryan | Bryanpreneurship
 
 
  • Post #5
  • Quote
  • May 24, 2016 11:02am May 24, 2016 11:02am
  •  bryan9725
  • | Joined Sep 2015 | Status: Member | 60 Posts
I went Long on USD/SGD a few days ago. I think I made that decision on impulse so I didn't see it then but now that I look at it, I can see that prices are close to the previous high that occurred 2 months ago. There is a chance and probably a high one that prices would not break out of this resistance. Anyway, I have already set my stop loss so I would wait and see what happens.
Attached Image (click to enlarge)
Click to Enlarge

Name: Screenshot1.png
Size: 108 KB
Bryan | Bryanpreneurship
 
 
  • Post #6
  • Quote
  • May 24, 2016 11:06am May 24, 2016 11:06am
  •  bryan9725
  • | Joined Sep 2015 | Status: Member | 60 Posts
This is my current trading plan draft. There still many things that needs lots of work, I know. But this is my start and I will try to make it better from here.

Amount of starting capital to be used for trading:

$50

Primary lot size and leverage used

50 Nano Lot at a 1:50 leverage

Maximum Number of Open Trades At Any Time:

4 trades

Maximum percentage of trading capital risked on each trade

4%

Reward-to-risk ratio target

Minimum of 1:2

Realistic daily, weekly and monthly profit goals.

Daily: No Target
Weekly: 80 Pips
Monthly: 350 Pips

Specific daily, weekly, and monthly loss limits (the point of monetary loss at which a trader stops trading for the given period)

Weekly: 50 Pips – Stop trading for 3 days
Monthly: 150 Pips – Stop trading For 1 Week


An entire description of the trading strategy(s) used


The strategy name is called multiple time frame trading. This means using 3 different timeframes to analyze the market conditions and trends. The first is the long term time frame, the second is the intermediate (primary) timeframe and the third is the short term time frame.

The long term time frame should be four times the primary time frame and the primary time frame should be four times the short term time frame.

The long term chart is used to determine the overall trend of the market. Positions should not be executed based on this wide angled chart.

The primary chart is used to determine the current conditions of the market and whether or not a position should be open. It can also used to determine the stops and profit goals for the trade.

The short term chart is used to determine when is the best time for the trade to be open. As the smaller fluctuations in price action become clearer, I will be better able to pick an attractive entry for a position whose direction has already been defined by the higher frequency charts.

Technical indicators used in this strategy:
Parabolic SAR (0.2,0.2)
ADX (14)


Specific trade entry criteria according to the tested trading strategy

For a long trade:

Long term chart must be in a bullish trend. This is confirmed when the +DMI is above the –DMI.
*It is optional for the ADX level to be above 25 but it would be best if it is.

Intermediate Chart must be trending in the same direction as the long term chart. This strategy does not trade retracements. ADX level must be above 25 and +DMI must be above –DMI.

Short term chart must have Parabolic SAR stop losses for a long trade. If there is a trend, positions can only be entered at the beginning of the trend. If the trend has been going on for quite a while, wait for retracements before opening a position.

For Short Trade:

Vice-versa

Specific trade exit criteria (stop losses, profit limits, and/or manual exits) according to the tested trading strategy.

Option 1:
Stop loss will be set on the last Parabolic SAR point on the intermediate chart.
Take profit at double the stop loss pips

Option 2:
Expert Judgement

*No matter what option chosen, the Risk/Reward ratio must always be at least 1:2.
Bryan | Bryanpreneurship
 
 
  • Post #7
  • Quote
  • May 24, 2016 11:22am May 24, 2016 11:22am
  •  bryan9725
  • | Joined Sep 2015 | Status: Member | 60 Posts
When I looked at this chart. It felt like it was screaming at me to go for a short. I guess I still lack self-control because this totally violated the strategy draft I have above and yet, I went short anyway. I feel like a sucker and I would really need to learn to control myself. Thankfully, I am only putting in a very small amount of money. If not, I would be begging on the streets right now....

Attached Image (click to enlarge)
Click to Enlarge

Name: Screenshot1.png
Size: 129 KB

Attached Image (click to enlarge)
Click to Enlarge

Name: Screenshot2.png
Size: 118 KB
Bryan | Bryanpreneurship
 
 
  • Post #8
  • Quote
  • May 25, 2016 1:05pm May 25, 2016 1:05pm
  •  bryan9725
  • | Joined Sep 2015 | Status: Member | 60 Posts
I don't feel very comfortable using the strategy that I created, and I have felt the exact same way with the other strategies that I have had in the past. I think this is happening because I was really just creating a strategy for the sake of a strategy. I first thought of the tools I wanted to use and before thinking of the strategy that I am going to have using those tools. As a result, my strategy was created around the tools that I use instead of me. And because of this, none of the strategies I have had already resonated with me as a person and my trading personality. This means that the strategy that I have just created is now useless because it doesn't match up with me and I don't know why I am doing what I am doing.

In the next strategy, I must first think of what I want my strategy to be like before I figure out what indicators I want to use to back this strategy up. This sounds more like the way I should do this and I think I will feel very comfortable with this method, hopefully.
Bryan | Bryanpreneurship
 
 
  • Post #9
  • Quote
  • May 26, 2016 7:06am May 26, 2016 7:06am
  •  bryan9725
  • | Joined Sep 2015 | Status: Member | 60 Posts
Attached Image (click to enlarge)
Click to Enlarge

Name: Screenshot1.png
Size: 725 KB
Bryan | Bryanpreneurship
 
 
  • Post #10
  • Quote
  • Edited 1:53pm May 26, 2016 1:42pm | Edited 1:53pm
  •  Bicarus
  • Joined Nov 2014 | Status: Yoda | 927 Posts
cheers, visited your blog. barely 20 and starting to trade. kudos to you.
judging by your TE, you aint doing very well. but fret not. you're still young and time is on your side. this is the time to make all the mistakes you can. before life drops more burdens on your shoulders.

couple of advice:
- stop relying on indicators to enter/exit trade. they should merely be there to reinforce your conviction
- be updated with current affairs, when i say updated. meaning the moment it releases you know about it. can check out ransquawk.com if you are going to seriously commit to trading
- know the correlation of fundamentals and currency pairs at the back of your hand, knowledge is power
- learn to admit defeat and cut losses early, like any relationship/work. if it doesnt fit, it doesnt fit. the more one drags on, the more it will hurts. never ever pep talk/reassure yourself that its all gonna be okay.
- be extremely well versed in supply and demand

with that i wish you e best of luck!!
 
 
  • Post #11
  • Quote
  • Jun 21, 2016 6:26am Jun 21, 2016 6:26am
  •  bryan9725
  • | Joined Sep 2015 | Status: Member | 60 Posts
The past few weeks was horrible. Every trade I opened made negative and it sucks totally. I have been wondering aimlessly for the past few weeks and I realised that I have not solid trading plan. And when I try to create one myself, I don't know where to start. So instead of trying so hard to come up with an original strategy, I would follow one simple strategy that I found here on Forex Factory and then work my way up from there. I'm no saying that give up on coming up with something on my own. Rather I am using this strategy as a start to help me better develop my own strategy that is not only profitable but suitable for me too.

This is the strategy I am going to use as a start:

Hi,

About few months ago I read a thread which is called " Trading Made Simple" . They used TDI indicator and TMS to monitor charts and find possible entries. I tried this system for some months but I gained 40% success from their system. I tried to modify the system to find out higher potential entries. Following I will explain my strategy which can be used for newbies of TDI system.
I personally prefer to use method 1 for daily chart, as I need to only check the charts at the start of the day and open possible positions and leave it until the end of the day. So it is stress free strategy. However, both method 1 and 2 can be used for 4H if you like to monitor graphs during the day.

Method 1 :

At the beginning of the day, I will check all 28 pairs for possible entries based on the following rules:

BUY:

1) Stochastic : Should be over 80
2) TDI : a) Green should cross above the red line or show a rebound b) prefer that cross or rebound happened above the yellow line.

Sell:

1) Stochastic : Should be bellow 20
2) TDI : a) Green should cross bellow the red line or show a rebound b) prefer that cross or rebound happened bellow the yellow line.


Method 2:

If I want to look at 4H charts for more entries, ( usually when I do not have any entries from method 1 at the beginning of the day), during the day , I will follow the bellow rules:

1) Check method 1 for possible entries on chart 4H
or

2) BUY:

2-1) Stochastic : near or above 50
2-2) TDI : a) looking for cross or rebound but where it is near or above yellow line b) cross or rebound upward


3) SELL:

3-1) Stochastic : near or BELLOW 50
3-2) TDI : a) looking for cross or rebound but where it is near or BELLOW yellow line b) cross or rebound DOWNWARD


I will add charts to clarify the strategy.

These methods provided 80% successful entries for me !!!!! You can back test from history data to check the possible entries.

Comments are welcome......

I got it from here: http://www.forexfactory.com/showthread.php?t=588548

My exams are round the corner so I think my pace would be even slower these few days.
Bryan | Bryanpreneurship
 
 
  • Post #12
  • Quote
  • Jun 21, 2016 6:27am Jun 21, 2016 6:27am
  •  bryan9725
  • | Joined Sep 2015 | Status: Member | 60 Posts
Quoting Bicarus
Disliked
cheers, visited your blog. barely 20 and starting to trade. kudos to you. judging by your TE, you aint doing very well. but fret not. you're still young and time is on your side. this is the time to make all the mistakes you can. before life drops more burdens on your shoulders. couple of advice: - stop relying on indicators to enter/exit trade. they should merely be there to reinforce your conviction - be updated with current affairs, when i say updated. meaning the moment it releases you know about it. can check out ransquawk.com if you are going...
Ignored
thank you
Bryan | Bryanpreneurship
 
 
  • Post #13
  • Quote
  • Jun 22, 2016 11:00am Jun 22, 2016 11:00am
  •  bryan9725
  • | Joined Sep 2015 | Status: Member | 60 Posts

My Trading Plan


Main Analysis:

1. Stochastic Indicator (14,3,3)

  1. If the level is above 80, prices are said to be overbought. (Bull)
  2. If level is below 20, prices are said to be oversold (Bear)

2. ADX (14)

  1. If ADX is above 25, the trend is said to be strong.
  2. If ADX is below 20, there is no trend.
  3. If ADX is 20 - 25, the trend is weak.
  4. If DMI+ is above DMI-, prices are said to be bullish.
  5. If DMI- is above DMI+, prices are said to be bearish.


Strategy Description:
This strategy makes use of multiple timeframes to generate trading signals. There is the main timeframe, the large timeframe and the small timeframe. The large timeframe is used to determine the overall market sentiments. The medium timeframe is used to determine the more immediate market sentiments. The small timeframe is used to determine the right entry point. It is said that the large timeframe should be 4 times the medium timeframe and the medium timeframe should be 4 times the small timeframe. I am most comfortable trading a 4 hour timeframe so I would use it as my medium timeframe. With that said, the large timeframe would be 1 day and the small time frame would be 1 hour.

This strategy is simple, a trading signal is generated when both large and medium timeframe have a strong market sentiment in the same direction.

Step 1:

Main analysis is done on the large timeframe. If the result indicate that there is a strong trend and both indicators are pointing to the same direction, it is said that prices are currently in a strong trend and will most likely continue trending in the current direction. When such a condition is present, step 2 can start. If not, this currency pair is invalid and I should move on to another pair.

Step 2:
Do another main analysis on the medium timeframe and if the result also indicates a strong trend and both indicators are pointing to the same direction as the large trend is pointing to, a trading signal has occurred and step 3 can happen. If not, move on to another currency pair.

Step 3:
Now that the signal is created, it is now time to check is now is the right time for entry. This is done by analysing the short timeframe. If the main process generates the same result as the medium and large timeframe, that would be best. If not, it is okay as long as there are no signs or price reversal or that prices are currently trading in range [Upper and Lower Bands of Bollinger Bands (14,2) must not be very close together]. If the time is not right, come back a few hours later and check on it again until all conditions are in order. If the time is right, open a trade and place a trailing stop on the first dot on Parabolic SAR (0.02, 0.2) on the medium timeframe.

Bryan | Bryanpreneurship
 
 
  • Post #14
  • Quote
  • Jun 22, 2016 11:02am Jun 22, 2016 11:02am
  •  bryan9725
  • | Joined Sep 2015 | Status: Member | 60 Posts
I must be disciplined with myself to stick to this trading plan until at least the end of the month. Every trade must be screen shot and documented here.
Bryan | Bryanpreneurship
 
 
  • Post #15
  • Quote
  • Jun 22, 2016 11:08am Jun 22, 2016 11:08am
  •  bryan9725
  • | Joined Sep 2015 | Status: Member | 60 Posts
Prices on all timeframe were trending strongly bearish so I decided to open a position. Stop loss was placed on the first dot from Parabolic SAR on the medium (4 hr) timeframe.
Attached Image(s) (click to enlarge)
Click to Enlarge

Name: Screen Shot 2016-06-22 at 11.05.53 PM.png
Size: 150 KB
Click to Enlarge

Name: Screen Shot 2016-06-22 at 11.06.03 PM.png
Size: 135 KB
Click to Enlarge

Name: Screen Shot 2016-06-22 at 11.06.13 PM.png
Size: 129 KB
Bryan | Bryanpreneurship
 
 
  • Post #16
  • Quote
  • Jun 22, 2016 11:11am Jun 22, 2016 11:11am
  •  bryan9725
  • | Joined Sep 2015 | Status: Member | 60 Posts
Prices on all timeframe were also trending strongly bullish so I decided to open a position. Stop loss was placed on the first dot from Parabolic SAR on the medium (4 hr) timeframe. Right now as I am typing, both trades are losing. I will let it play out and we'll see what happens.
Attached Image(s) (click to enlarge)
Click to Enlarge

Name: Screen Shot 2016-06-22 at 11.09.32 PM.png
Size: 137 KB
Click to Enlarge

Name: Screen Shot 2016-06-22 at 11.09.40 PM.png
Size: 131 KB
Click to Enlarge

Name: Screen Shot 2016-06-22 at 11.09.48 PM.png
Size: 126 KB
Bryan | Bryanpreneurship
 
 
  • Post #17
  • Quote
  • Jul 6, 2016 12:33pm Jul 6, 2016 12:33pm
  •  bryan9725
  • | Joined Sep 2015 | Status: Member | 60 Posts
Went long on AUDNZD. The main time frame I am looking at here is the 1 Hour time frame. So the larger time frame would be 4 hour and the small time frame would be 30m. After analysing the large time frame based on the Stochastic and ADX indicator, I concluded that prices are heavily overbought but the trend is little to none. However, when analysing the 1 hour time frame, prices are also heavily overbought and prices are trending strongly and the same applies to the 30m time frame. This suggests that the prices are not strongly trending in a bullish direction on the larger scale but on the main time frame and small time frame, indicators suggests that prices would trend strongly for at least the next few period. This is the reason why I opened a bullish trade.
Attached Image(s) (click to enlarge)
Click to Enlarge

Name: audnzd1hr.JPG
Size: 228 KB
Click to Enlarge

Name: audnzd4hr.JPG
Size: 241 KB
Click to Enlarge

Name: audnzd30m.JPG
Size: 239 KB
Bryan | Bryanpreneurship
 
 
  • Post #18
  • Quote
  • Jul 6, 2016 1:07pm Jul 6, 2016 1:07pm
  •  bryan9725
  • | Joined Sep 2015 | Status: Member | 60 Posts
This one looks so promising. The 4Hr chart suggested a move away from it's oversold condition by gradually increasing it's stochastic numbers. The 1 Hr and 30M chart on the other hand were wildly bullish with Stochastic levels on both charts reaching the peak and being so close to 100 suggesting extreme overbought conditions while ADX on both charts signals a strong trend which means that prices are most likely going to stay bullish for the next few periods. This is why I entered long.
Attached Image(s) (click to enlarge)
Click to Enlarge

Name: usdjpy1hr.JPG
Size: 230 KB
Click to Enlarge

Name: usdjpy4hr.JPG
Size: 245 KB
Click to Enlarge

Name: usdjpy30m.JPG
Size: 235 KB
Bryan | Bryanpreneurship
 
 
  • Post #19
  • Quote
  • Jul 7, 2016 11:22am Jul 7, 2016 11:22am
  •  bryan9725
  • | Joined Sep 2015 | Status: Member | 60 Posts
A good article

http://www.xe.com/currencytrading/improve.php
Bryan | Bryanpreneurship
 
 
  • Post #20
  • Quote
  • Jul 7, 2016 11:40am Jul 7, 2016 11:40am
  •  bryan9725
  • | Joined Sep 2015 | Status: Member | 60 Posts
This trade is almost completely in sync with my strategy. The only thing is that in the short term frame (1 hr), there wasn't really a strong trend and in the main frame, Stochastic levels were low, but not low enough to hit 20.. Other than that, I think that all the conditions were perfect for a short trade. The large time frame (1 day) is strongly trending in an extremely oversold condition while the main time frame is also strongly trending in a mildly oversold condition. The small time frame is mildly trending in an increasingly oversold condition. The charts may not be the perfect chart but I think that it is still a very sound option considering the current conditions.
Attached Image(s) (click to enlarge)
Click to Enlarge

Name: 1day.JPG
Size: 255 KB
Click to Enlarge

Name: 1hr.JPG
Size: 234 KB
Click to Enlarge

Name: 4hr.JPG
Size: 241 KB
Bryan | Bryanpreneurship
 
 
  • Trading Journals
  • /
  • My Baby Squirtle
  • Reply to Thread
    • Page 1 2 3
    • Page 1 2 3
0 traders viewing now
  • More
Top of Page
  • Facebook
  • Twitter
About FF
  • Mission
  • Products
  • User Guide
  • Media Kit
  • Blog
  • Contact
FF Products
  • Forums
  • Trades
  • Calendar
  • News
  • Market
  • Brokers
  • Trade Explorer
FF Website
  • Homepage
  • Search
  • Members
  • Report a Bug
Follow FF
  • Facebook
  • Twitter

FF Sister Sites:

  • Metals Mine
  • Energy EXCH
  • Crypto Craft

Forex Factory® is a brand of Fair Economy, Inc.

Terms of Service / ©2023