Hi kirkleaforex. Quite some potential here...
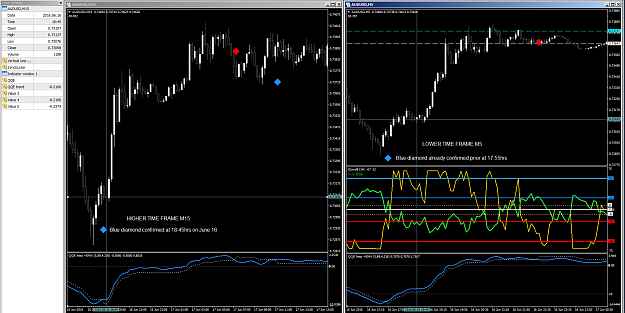
For those who want to backtest, since MTF charts are involved, I can suggest a couple of indicators to either scroll forward two or more charts contemporarily or to check out past events occurring at the same time. The first one is downloadable for free here and the second one is attached (I think I downloaded it on FF some time ago). Use should be quite intuitive.
For those who want to backtest, since MTF charts are involved, I can suggest a couple of indicators to either scroll forward two or more charts contemporarily or to check out past events occurring at the same time. The first one is downloadable for free here and the second one is attached (I think I downloaded it on FF some time ago). Use should be quite intuitive.
Attached File(s)