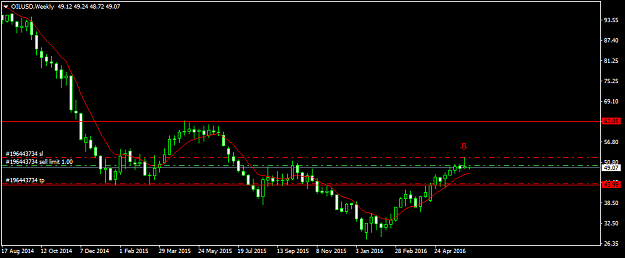
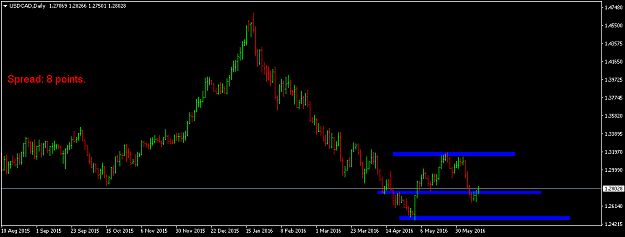
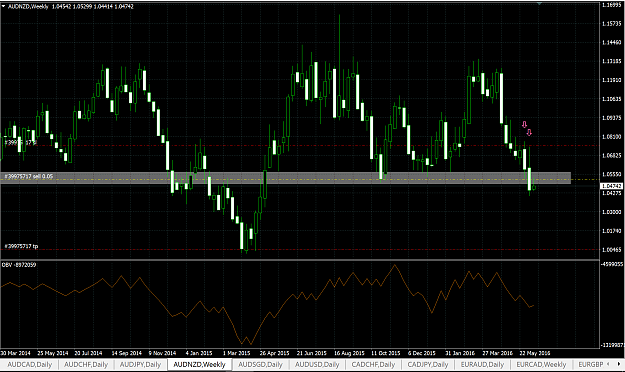
{quote} Hi VK. Since you ask i'll respond, but please know that i am just a humble student. Look above. You are trading into a PPZ at around 1.28000 BRN area, so you might have some trouble there. I've attached a weekly chart which gives a slightly bigger picture. The immediate trend also looks down to me, but price may very well go up from here too. For me, i would be looking for short trades on this chart. Are you trading with real money? Good luck. {image}
Ignored
Hi GB, Maybe you are humble student, but I am sure, that you are better than me, so I have to learn from you.... Thanks for your time.
Everytime I try to identify trend or read chart, I am wrong . Maybe my metodology is wrong, because my criteria arent the same....I think I should an indicator which will work with the same criteria on all charts..... I see you are using moveing average, what kind is it and what period do you use ? Do you use other indicators ?
{quote} Hi GB, Maybe you are humble student, but I am sure, that you are better than me, so I have to learn from you.... Thanks for your time. Everytime I try to identify trend or read chart, I am wrong . Maybe my metodology is wrong, because my criteria arent the same....I think I should an indicator which will work with the same criteria on all charts..... I see you are using moveing average, what kind is it and what period do you use ? Do you use other indicators ?
Ignored
VK, I am experimenting with different moving averages, but i don't rely on them. I don't think it is a good idea for me to be suggesting MA's or certain indicators to a beginner, as trading can be confusing enough and it can lead to bad habits relying on them instead of PA. But i don't use indicators at this point. I look at price action and i prefer to rely on that. Keep working at it, you will get it. Do you zoom out on your daily charts to determine the trend, or whether there is no trend/ranging? Zoom your daily chart out. Then zoom your weekly chart out. Is the overall, main trend easy to see? Is it up? down? sideways? Are you enjoying page 1, post 1 and all it's links? All the best, GB.
{quote} VK, I am experimenting with different moving averages, but i don't rely on them. I don't think it is a good idea for me to be suggesting MA's or certain indicators to a beginner, as trading can be confusing enough and it can lead to bad habits relying on them instead of PA. But i don't use indicators at this point. I look at price action and i prefer to rely on that. Keep working at it, you will get it. Do you zoom out on your daily charts to determine the trend, or whether there is no trend/ranging? Zoom your daily chart out. Then zoom...
Ignored
GB, I use weekly and daily charts to spot trends, but as you can see, i am not good with it... Yes I am reading whole thread from page 1 and found there very usefull stuff.
To usd/cad discussed about- I saw weekly chart too, but i saw there uptrend- and you saw downtrend. I thought, that from beginning of may( bullish engulfing on weekly chart) it signals, that the uptrend continues....What is the signal or what should happen to change your view from UP to DOWNTrend ? When you have changed your view to down on usd/cad ?
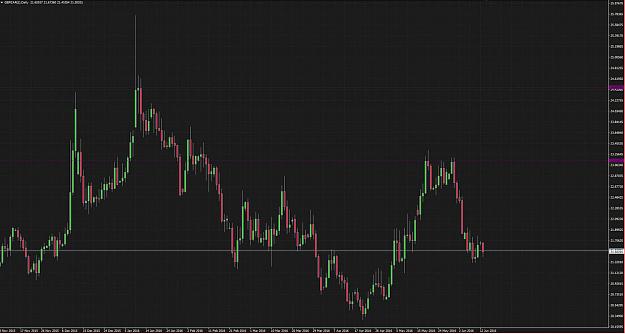
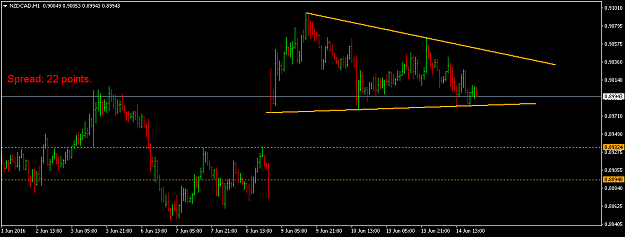
You might be looking for something that isn't there. There isn't always a clear up / down trend on a chart, take this for example, is it up or down or sideways? Is there an opportunity here? Would it be better to buy / sell here or at 23.1 / 24.4 / not at all? It's up to you.
Depending on what you are looking for you could be waiting days / weeks for a opportunity that interests you. I'm finding taking fewer high quality trades is helping my confidence.
@VK You might be looking for something that isn't there. There isn't always a clear up / down trend on a chart, take this for example, is it up or down or sideways? Is there an opportunity here? Would it be better to buy / sell here or at 23.1 / 24.4 / not at all? It's up to you. Depending on what you are looking for you could be waiting days / weeks for a opportunity that interests you. I'm finding taking fewer high quality trades is helping my confidence. Keep posting your charts! {image}
Ignored
@dave0
Thank for your comment....I know, that cleary identify the trend is difficult, because somtimes the trend is absent. But when the trend existist I have to identify it.
To your gbp zar chart: You give super example of what i am thinking and can not find solution ....
From 20.april to +- 20may- clear nice uprend. Then comes retreace to value 21,50. When bullish signal occurs( pinbar or engulfing) would it be reason to go up ? If yes, would it be with or against trend ?
I try to buy on retreacement when price action occurs which will corespond with the trend, but the chart you have posted is typical situation where I dont know If I am trading with or against trend .... thankyou for your opinion...have a nice day
Ah ok, I think I see what you are saying. It sounds like you are struggling to find entry signals? Perhaps you could do some research on 'levels'? I'll add a quick chart to help.
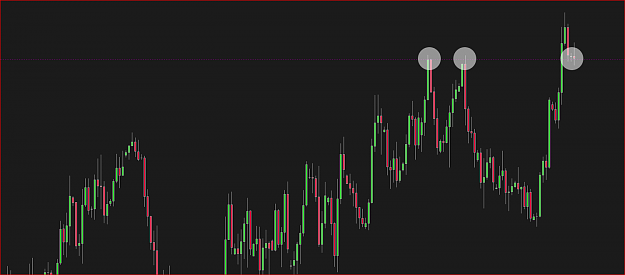
This is a (badly cropped) chart of NZD/USD today, do you see where price is and how it has reacted the 2 previous times it has been here? This is what means it's worth closer inspection. It _doesn't_ mean that we should enter here. Or to put it another way - this is an area to investigate. This to me this is an area that could be good to go long from but the current PA isn't conclusive (for me) yet.
I mark levels that I am interested in keeping an eye on the next time price gets around them. After that the price action and trend will help me with direction, stop and limit.
I think you are correct with GBP/ZAR chart - it's difficult to see where to enter, and that's the point I am making. If you can't see the opportunity then there isn't one, and you shouldn't try to force it.
Hopefully this is helpful - I'm no expert, we are all learning here.
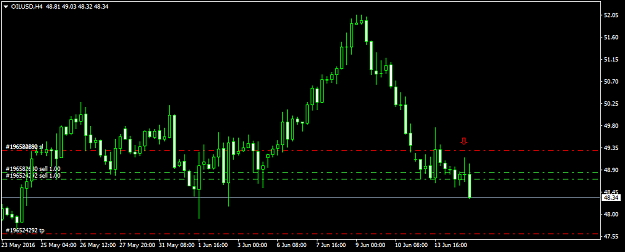
@VKTrader i'm also a newbie more newbie than GB, but i think in USD/CAD the price is at the midpoint of the box(maybe Mike can correct me here if i'm wrong) ; it's tough to trade the midpoint; better trade the top and bottom of the box
also i think you need to understand when price is consolidating and when it's a trend; remember 70% of the time price consolidates; i will upload a video from James16 where Jim say a lot better what i said ( Mike, if i'm not allowed due the copyright or something else i will delete the video)
@VKTrader i'm also a newbie more newbie than GB, but i think in USD/CAD the price is at the midpoint of the box(maybe Mike can correct me here if i'm wrong) ; it's tough to trade the midpoint; better trade the top and bottom of the box also i think you need to understand when price is consolidating and when it's a trend; remember 70% of the time price consolidates; i will upload a video from James16 where Jim say a lot better what i said ( Mike, if i'm not allowed due the copyright or something else i will delete the video) {image} {file}
Ignored
Thank you for your post and video- it was helpful for me....
To your usd/cad chart: I saw bullish engulfing- I know it is in the middle, but at good level- marked blue on your chart. I wanted to entry at thursday high, with target 1,28 but then I became afraid and canceled that buy order now I see I missed my profit ....
Ah ok, I think I see what you are saying. It sounds like you are struggling to find entry signals? Perhaps you could do some research on 'levels'? I'll add a quick chart to help. This is a (badly cropped) chart of NZD/USD today, do you see where price is and how it has reacted the 2 previous times it has been here? This is what means it's worth closer inspection. It _doesn't_ mean that we should enter here. Or to put it another way - this is an area to investigate. This to me this is an area that could be good to go long from but the current PA...
Ignored
Yes, you are right, I am struggling with my entries. I am not able to develop system which works for me. I only try to find something but I dont know what is it... I tried many different systems, I learnt that every strategy works, but you never knows when also indicators works, but it works now but next time it doesnt. also pinbars works, but you never know when it is the time that they works... I think I solved problems with trends for now and instead I should try to find areas and watch what price makes at that levels... that will be the best answer to question : what trend it is. I think that it is waste of time to search for trends because most of time there are no trends- only chop/ sideways...- As one good trader said: when the trend can by identified by a child, than it is trend
Hi VK. Yes, Nice BUOVB on USD/CAD Weekly chart. It may take off higher still, but the problem was/is the PPZ you would've been trading into around 1.28000 area. I think your observation of W1 BUOVB is a good one though. Keep at it and don't listen to students like me lol. Above all, take your time and enjoy the learning journey. You cannot rush it. (now i am watching that buovb on W1. Got me curious )
Hi VK. Yes, Nice BUOVB on USD/CAD Weekly chart. It may take off higher still, but the problem was/is the PPZ you would've been trading into around 1.28000 area. I think your observation of W1 BUOVB is a good one though. Keep at it and don't listen to students like me lol. Above all, take your time and enjoy the learning journey. You cannot rush it. (now i am watching that buovb on W1. Got me curious )
Ignored
Hi GB.
I think in this case both of us are right. The BUOVB on weekly can send the price higher, but the PPZ at 1,28 or 1,3 which is BRN and this area is near. So there have to be something more than "only" one bullish candle because the down pressure is strong. I will wait for next candles and will see what will happen.....
GBP/AUD D1 PB. PB closed bearish so not ideal, but other confluence present such as previous event area/where price headed north from. Some profit locked in. Watching Oil, U/C too.
Attached Image (click to enlarge)
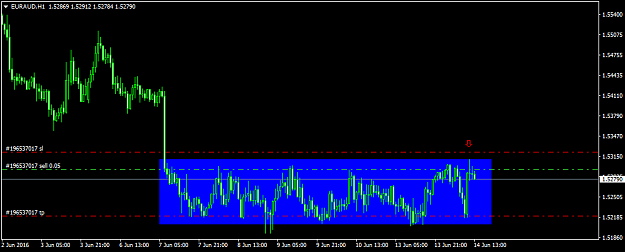
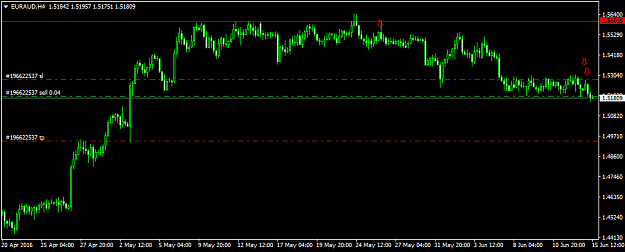
Edit: EUR/AUD H1. Trading the box from the top. Thanks Flo!
Apart from the GBP/AUD trade i'm in from last week which is going nicely, there hasn't been to much around for us M1,W1,D1 traders.
Just spied these two a few hours ago. Early days but promising.
AUD/NZD W1 2-week BEOB. Got a nice retrace entry up into support-now-resistance.
EUR/CAD W1 BEOB. Will be getting to BE sooner rather then later although i think it's good to get to 1.430 at least.
Will be looking to add-on if PA shows the way.
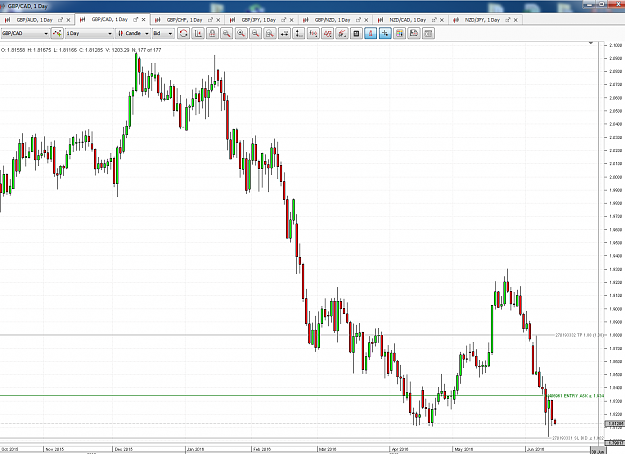
Hi, what do you think about this GBP/ CAD setup ? I am trading pinbar formed at area, which was rejected in the past, pinbar has also both eyes . I am waiting for confirmation what means that the price will go up- above pinbar high. Because of this I set buy order +-10pips above pinbar high.