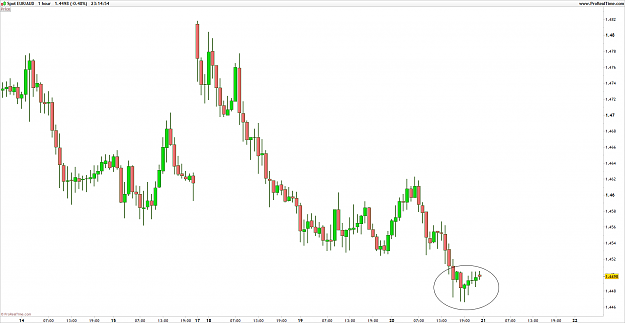
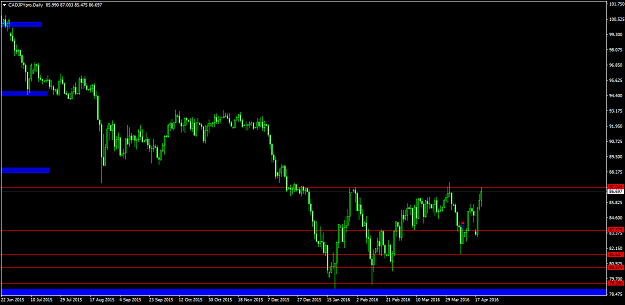
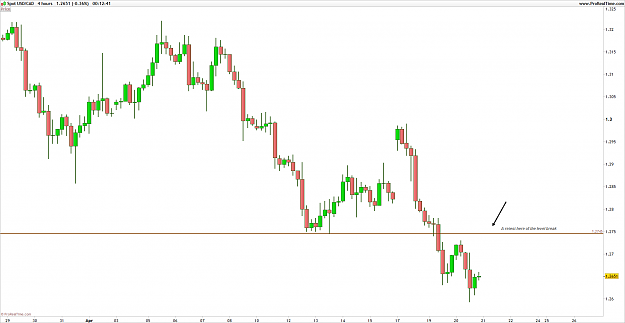
DislikedHi there Simon, Im currently looking at ECAD. On my first chart which is the daily. On the 19th aug 15 there was a big rally up from support area 14392 We then had a staggered reversal/retrace back and it broke below the 14392. On the 3rd of Dec 2015 it broke back with great momentum through 14392. It has currently but subtly closed below the 14392 area again how would you handle the subtile close?. On the hourly so far i.e a couple of candles (into next block) there has been a minor retest and and the area has held. I have 2 questions would the...Ignored
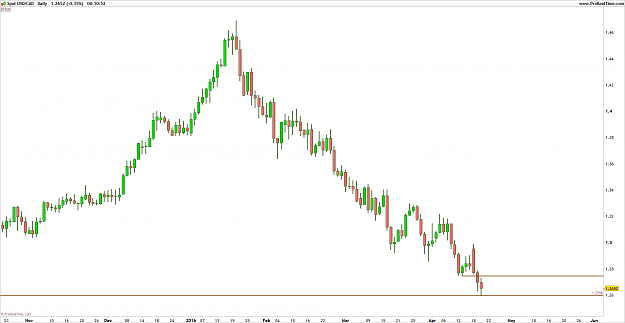
So on d1 chart I see 14030 as the next one although its used and abused so a minor level, 13520 same story used and abused, then the first real level for long 13020
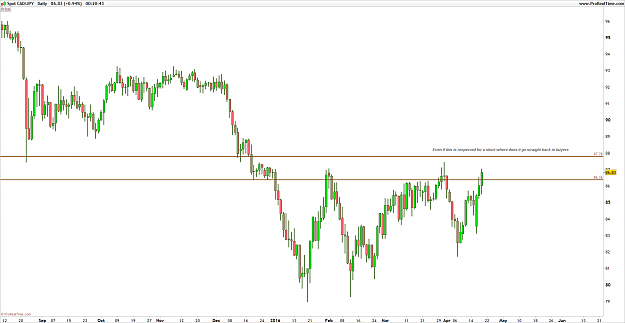
I am a seller of ecad wanted to get it the other day at 14700 but didn't quite make it. I would look to sell rallies into pullbacks to levels that have just been used and abused cause there not holding for longs. 14700, 14850, these are minor intraday levels so you need to keep SL tight but good for shorts cause they have been largely exhausted now for longs.
Simon
99% of Traders fail, so don't follow the herd