• Home
  • Forums
  • Trades
  • News
  • Calendar
  • Market
  • Brokers
  • Login
  • Join
  • User/Email: Password:
  • 11:37pm
Menu
  • Forums
  • Trades
  • News
  • Calendar
  • Market
  • Brokers
  • Login
  • Join
  • 11:37pm
Sister Sites
  • Metals Mine
  • Energy EXCH
  • Crypto Craft

Options

Bookmark Thread

First Page First Unread Last Page Last Post

Print Thread

Similar Threads

COT: The precious data ignored 617 replies

Big Pig's Successful Day Trading 43 replies

second order ignored 0 replies

  • Trading Journals
  • /
  • Reply to Thread
  • Subscribe
  • 23
Attachments: Successful Fundamentals trading (DAY Trading WILL BE Ignored)
Exit Attachments
Tags: Successful Fundamentals trading (DAY Trading WILL BE Ignored)
Cancel

Successful Fundamentals trading (DAY Trading WILL BE Ignored)

  • Post #1
  • Quote
  • First Post: Edited 10:28pm Mar 11, 2015 9:56pm | Edited 10:28pm
  •  hippoownyou
  • | Joined Jul 2014 | Status: Member | 89 Posts
Successful Trading using Fundamentals

The vision : To compete with the big boys. (Banks, Hedge funds, Mutual funds, Insurance companies, anything that is finance related)
The goal : Set a reasonable stop loss and allow profits to run consistently.
The plan : Using fundamentals to support and give reason for your trade.

What are fundamentals?

Investopedia definition:
The qualitative and quantitative information that contributes to the economic well-being and the subsequent financial valuation of a company, security or currency. Analysts and investors analyze these fundamentals to develop an estimate as to whether the underlying asset is considered a worthwhile investment.

For businesses, information such as revenue, earnings, assets, liabilities and growth are considered some of the fundamentals.

From the above statement in Forex trading terms, what it implies is that both the micro and the macro contributes to the economic well being of the country. Compare it with another country and you have a currency pair. Qualitative and quantitative information. Qualitative information represents micro details such as economic news. Quantitative is the overall behavior aspect of the market. The most basic form of Quantitative information is our charts.

Thread etiquette:
NO DAY TRADING POSTS ( I have lost enough money day trading and I am not afraid to admit it )

ONLY POST CHARTS WITH LONG TERM TECHNICALS. ( This thread is for medium to long term traders expecting to hold trades for more than a week. If you want to be taken seriously in this thread, do not post any chart with technicals that is under 1h. )

DO NOT POST RUMORS OR CONSPIRACY THEORIES. If you want, do SUPPORT IT WITH EVIDENCE. ( Trading with conspiracy theories will put you in a losing position. The Fed does not believe in conspiracy crap, so do the banks and other finance companies. Believing in this conspiracy or rumor crap means that you are trading the unknown. This is fundamentals trading, not conspiracy trading. )

USE SUPPORTING EVIDENCE OR DATA FROM REPUTABLE SOURCES. ( Do not post your hyperlinks from shady websites. If you want to be taken seriously, do it like the professionals in the finance related industry, using news sources from reputable companies. Ex. Bloomberg, CNBC, BBC, Financial Times, Nikkei (JPY news). )

To end of the opening introduction, here is a classic meme
Attached Image
  • Post #2
  • Quote
  • Edited Mar 12, 2015 12:13am Mar 11, 2015 10:02pm | Edited Mar 12, 2015 12:13am
  •  hippoownyou
  • | Joined Jul 2014 | Status: Member | 89 Posts
Long term trade.

CHFJPY short

Fundamentals
- Swiss negative bond yields
- Capital flight in Swiss
- ECB asset purchase program till September 2016
- SNB selling its CHF reserves ( Mostly in exchange for EUR)

Technical
- Clean 4h triangle break ( 3-3-2015 )

Extreme scenario, Risk aversion
- Favoured to JPY,
- Capital Flight from Swiss to JP

Expected time frame, > 1 month until fundamentals change.

What can lead to a change in fundamentals
- Orthodox monetary policy by the SNB or BOJ
- BOJ introduces new round of stimulus or increases asset purchase programs.
- SNB starts reducing it's FX balance sheet

Chart as at 12-3-2015 10:00AM (8:00 GMT)
Attached Image (click to enlarge)
Click to Enlarge

Name: CHFJPY.png
Size: 15 KB
 
 
  • Post #3
  • Quote
  • Edited 10:30pm Mar 11, 2015 10:07pm | Edited 10:30pm
  •  hippoownyou
  • | Joined Jul 2014 | Status: Member | 89 Posts
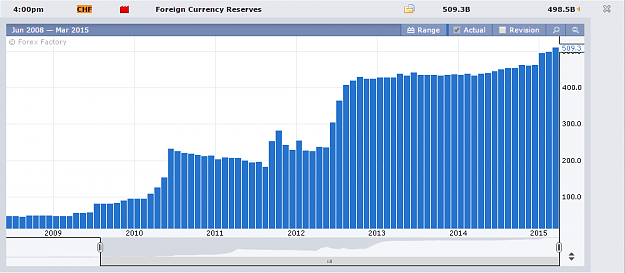
Proof of SNB Selling CHF to buy EUR or other currencies.

Since the removal of the EURCHF peg ( 15-1-2015 ) , SNB continued to increase its FX balance sheet.

http://www.reuters.com/article/2015/...0LA11F20150206
Attached Image (click to enlarge)
Click to Enlarge

Name: SNB FX balance sheet.png
Size: 19 KB
 
 
  • Post #4
  • Quote
  • Edited 10:32pm Mar 11, 2015 10:08pm | Edited 10:32pm
  •  hippoownyou
  • | Joined Jul 2014 | Status: Member | 89 Posts
Upcoming Key event risk to look out for

17-3-2015 (BOJ)
19-3-2015 (SNB, ECB)

Meanwhile, do look out for news on Greece.
If Greece bond yields spike, CHF denominated bonds will be affected.

Another key event risk to look out for is the ECB Quantitative Easing program, driving EU yields to record lows. This also forces CHF bonds to record low yields which are already negative.

At the very end of the spectrum, risk aversion may kick in resulting in de-leveraging of EUR assets.
Attached Image(s) (click to enlarge)
Click to Enlarge

Name: 17th March.png
Size: 4 KB
Click to Enlarge

Name: 18th March.png
Size: 7 KB
 
 
  • Post #5
  • Quote
  • Mar 11, 2015 10:11pm Mar 11, 2015 10:11pm
  •  hippoownyou
  • | Joined Jul 2014 | Status: Member | 89 Posts
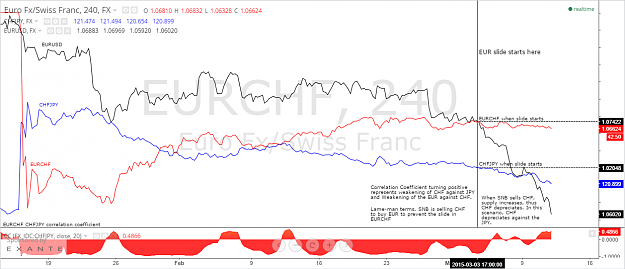
Technical analysis explained with fundamentals

Correlation Coefficient analysis.
Attached Image (click to enlarge)
Click to Enlarge

Name: CHF correlation coefficient.png
Size: 91 KB
 
 
  • Post #6
  • Quote
  • Edited Mar 12, 2015 8:20pm Mar 11, 2015 10:22pm | Edited Mar 12, 2015 8:20pm
  •  hippoownyou
  • | Joined Jul 2014 | Status: Member | 89 Posts
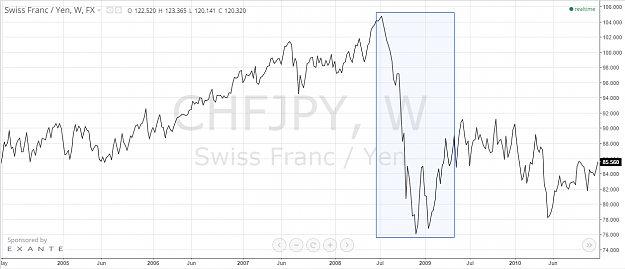
Here is a chart showing CHFJPY being a good hedge in extreme scenarios.

In this chart I have chosen the 2008 financial crisis.
It tells us that during extreme risk aversion scenario where the market starts to panic, de-leverage move is in favour of the JPY.
Capital flight from CHF to JPY > Capital Flight from JPY to CHF.
Attached Image (click to enlarge)
Click to Enlarge

Name: 2008 Financial Crisis.png
Size: 83 KB
 
 
  • Post #7
  • Quote
  • Edited 11:51am Mar 12, 2015 8:28am | Edited 11:51am
  •  hippoownyou
  • | Joined Jul 2014 | Status: Member | 89 Posts
Today is day 4 of ECB asset purchase program and the 4th straight day of the drop in Switzerland Government Bond yields.

Before the US open i would like to post this chart to justify my stance on my CHFJPY short.

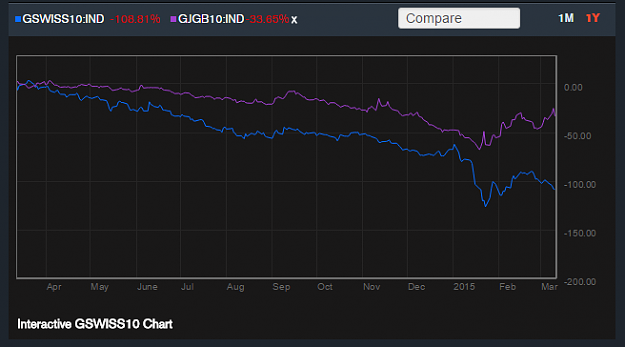
Here is a chart comparison between 10 year Swiss yield vs 10 year Japan yield.
Difference in yield entice investors to chase for higher returns. Thus resulting to capital flows. In this case, CHF --> JPY

Notice the trend of diverging bond yields.

source: http://www.bloomberg.com/quote/GSWISS10%3AIND
Attached Image (click to enlarge)
Click to Enlarge

Name: GSWISS10 vs GJGB10.png
Size: 31 KB
 
 
  • Post #8
  • Quote
  • Mar 12, 2015 11:31am Mar 12, 2015 11:31am
  •  hippoownyou
  • | Joined Jul 2014 | Status: Member | 89 Posts
A triangle pattern forming on the EURCHF 4h charts.

A break to either the up or the downside will definitely affect my CHFJPY short.

London session is ending soon, volatility in the markets is certainly waning.
Attached Image (click to enlarge)
Click to Enlarge

Name: EURCHF.png
Size: 22 KB
 
 
  • Post #9
  • Quote
  • Edited 8:27pm Mar 12, 2015 8:03pm | Edited 8:27pm
  •  hippoownyou
  • | Joined Jul 2014 | Status: Member | 89 Posts
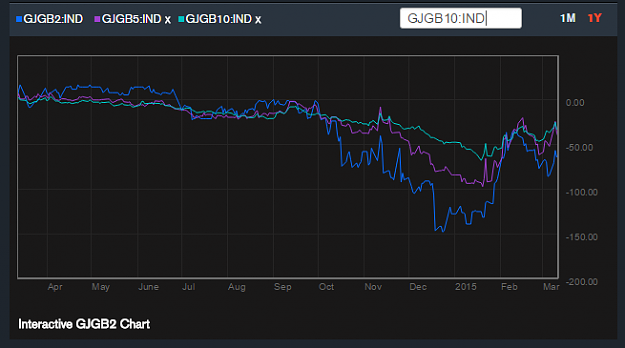
Here is the Japan Government bond yields comparison.

Blue - 2 year
Purple - 5 year
Green - 10 year

Notice the higher level of volatility on the 2 year bond.

Source : http://www.bloomberg.com/quote/GJGB2:IND
Attached Image (click to enlarge)
Click to Enlarge

Name: GJGB.png
Size: 32 KB
 
 
  • Post #10
  • Quote
  • Mar 13, 2015 5:18am Mar 13, 2015 5:18am
  •  hippoownyou
  • | Joined Jul 2014 | Status: Member | 89 Posts
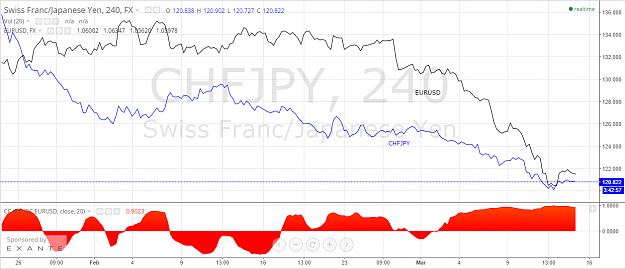
Incredible correlation coefficient between CHFJPY and EURUSD.
Both pairs are currently moving at the same direction.
Attached Image (click to enlarge)
Click to Enlarge

Name: EURUSD correlation coefficient.png
Size: 90 KB
 
 
  • Post #11
  • Quote
  • Mar 13, 2015 5:31am Mar 13, 2015 5:31am
  •  hippoownyou
  • | Joined Jul 2014 | Status: Member | 89 Posts
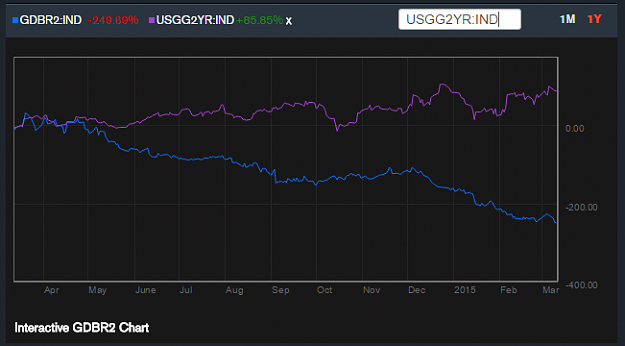
This certainly explains the decline in the EURUSD from may of 2014.
Here i have a chart comparison of German 2 year bund yields vs US 2 year bond yields.

For those who are wondering, I do have a EURUSD short at 1.11265

Have I closed my position? No

How long do I plan to hold it? I'll go with a wait and see approach.
- FOMC Economic Projections and Statement coming up next week.

I will post a chart of it soon.

Source : http://www.bloomberg.com/quote/GDBR2%3AIND
Attached Image (click to enlarge)
Click to Enlarge

Name: GDBR2 vs USGG2YR.png
Size: 25 KB
 
 
  • Post #12
  • Quote
  • Mar 13, 2015 8:11am Mar 13, 2015 8:11am
  •  hippoownyou
  • | Joined Jul 2014 | Status: Member | 89 Posts
GBPUSD incredible move to the downside puts this pair at a 2 year low. Breaking the low will be a huge psychological challenge. However we shall not rule out the possibility of it breaking given the fact that we have FOMC data coming out next Wednesday.
Attached Image (click to enlarge)
Click to Enlarge

Name: 2 year low.png
Size: 33 KB
 
 
  • Post #13
  • Quote
  • Edited 9:33pm Mar 13, 2015 9:02pm | Edited 9:33pm
  •  hippoownyou
  • | Joined Jul 2014 | Status: Member | 89 Posts
The triangle technical pattern at the EURCHF has been broken.

Having historically negative correlation, CHFJPY should spike up. However, notice how CHFJPY is not affected.
I assume it goes back to the 1.0 correlation with EURUSD.
Attached Image(s) (click to enlarge)
Click to Enlarge

Name: EURCHF Break.png
Size: 13 KB
Click to Enlarge

Name: EURJPY.png
Size: 11 KB
 
 
  • Post #14
  • Quote
  • Mar 13, 2015 9:05pm Mar 13, 2015 9:05pm
  •  hippoownyou
  • | Joined Jul 2014 | Status: Member | 89 Posts
Here is my EURUSD short.
I am looking to trail my stop to 1.075, but i need to see a pre-FOMC correction first.
Attached Image (click to enlarge)
Click to Enlarge

Name: EURUSD.png
Size: 15 KB
 
 
  • Post #15
  • Quote
  • Mar 13, 2015 9:21pm Mar 13, 2015 9:21pm
  •  Art5
  • | Joined Sep 2014 | Status: Member | 164 Posts
Hope to learn something from you.

Subscribed.
 
 
  • Post #16
  • Quote
  • Mar 16, 2015 3:12am Mar 16, 2015 3:12am
  •  hippoownyou
  • | Joined Jul 2014 | Status: Member | 89 Posts
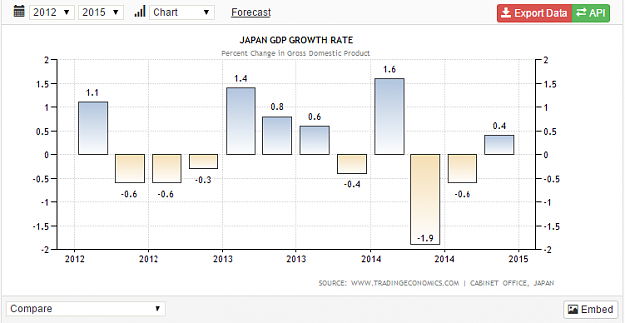
A quick refresh for the upcoming BOJ data tomorrow.

Slight increase in 4Q GDP growth, though below expectations.

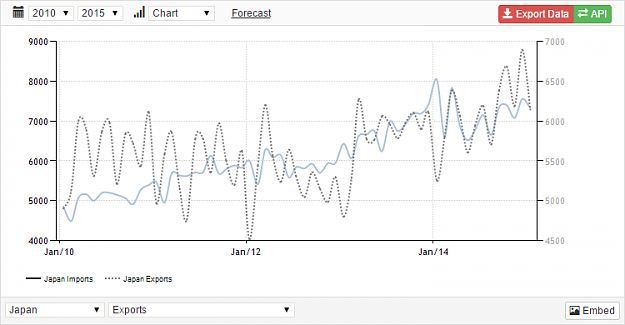
Weaker Yen is certainly benefiting the country's exports and imports have been starting to stabilise. What's really interesting is the consistent MoM trade surplus since QE was implemented in Japan.

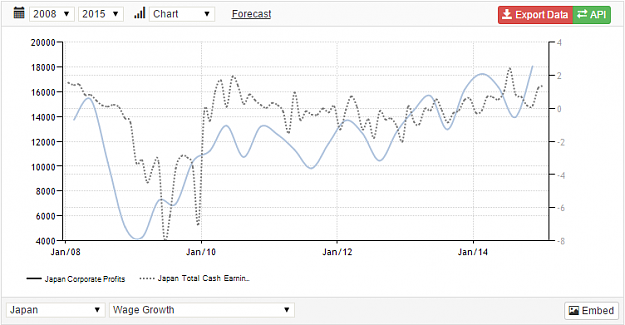
One area affected positively by the trade surplus will be the Japan corporate profits.
Increasing profits results to increasing wages.

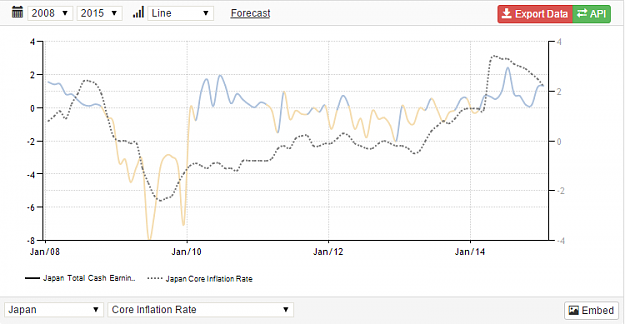
Lower commodity prices has certainly helped reduce core inflation, however, real wage growth has not outpaced core inflation.

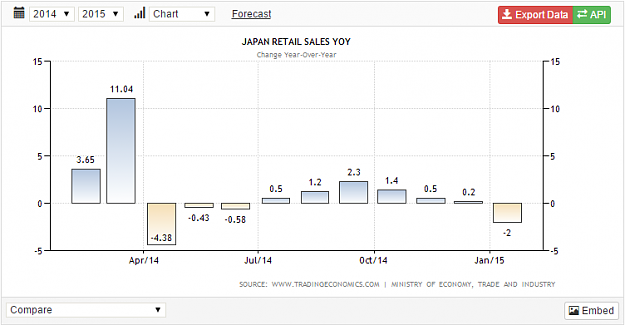
One particular data, Retail Sales data has continued to lag behind its counterparts. Retail Sales in Japan has yet to recover from the sales tax hike.

My thoughts:
The BOJ will continue to keep it's accommodative monetary policy to meet its long term inflation target of 2%. However, the recent decrease in 4Q core inflation should not be taken too seriously given the fact that the decrease was driven by lower commodity prices. Positive indicators such as increased corporate profits and wage growth will be further boosted by a corporate tax reform in the following months. Do look out for corporations repatriating their overseas profits as the Japanese fiscal year ends on the 31st March.

The verdict:
Don't expect huge surprises.

Source : http://www.tradingeconomics.com/japan/indicators
Attached Image(s) (click to enlarge)
Click to Enlarge

Name: GDP Growth.png
Size: 19 KB
Click to Enlarge

Name: Imports vs Exports.png
Size: 32 KB
Click to Enlarge

Name: Corporate profits vs wage growth.png
Size: 28 KB
Click to Enlarge

Name: Wage Growth vs Core inflation.png
Size: 27 KB
Click to Enlarge

Name: Retail Sales.png
Size: 15 KB
 
 
  • Post #17
  • Quote
  • Mar 17, 2015 9:39pm Mar 17, 2015 9:39pm
  •  hippoownyou
  • | Joined Jul 2014 | Status: Member | 89 Posts
Trailed my EURUSD short, locked in 400 pips. Waiting for the FOMC moment.

Notice the double bottom technical pattern on the 4h charts.
Attached Image (click to enlarge)
Click to Enlarge

Name: Double Bottom before the FOMC.png
Size: 14 KB
 
 
  • Post #18
  • Quote
  • Last Post: Oct 22, 2015 10:28pm Oct 22, 2015 10:28pm
  •  Sailing Home
  • | Joined Feb 2013 | Status: Member | 65 Posts
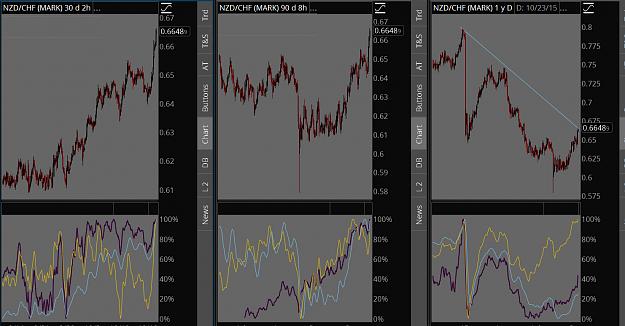
Just shorting this, as a Risk Aversion swing trade...potential stimulus from NZ will outweigh Safe Haven relief from CHF.

Not sure where it will go...it is counter intuitive...against the recent rally that continues to spike upward.

I'm trading the convergence in the 30 and 90 day technicals, against a possible trend line resistance level in the yearly level.

Would be nice to get some feedback.
Attached Image (click to enlarge)
Click to Enlarge

Name: nzd chf.jpg
Size: 225 KB
 
 
  • Trading Journals
  • /
  • Successful Fundamentals trading (DAY Trading WILL BE Ignored)
  • Reply to Thread
0 traders viewing now
Top of Page
  • Facebook
  • Twitter
About FF
  • Mission
  • Products
  • User Guide
  • Media Kit
  • Blog
  • Contact
FF Products
  • Forums
  • Trades
  • Calendar
  • News
  • Market
  • Brokers
  • Trade Explorer
FF Website
  • Homepage
  • Search
  • Members
  • Report a Bug
Follow FF
  • Facebook
  • Twitter

FF Sister Sites:

  • Metals Mine
  • Energy EXCH
  • Crypto Craft

Forex Factory® is a brand of Fair Economy, Inc.

Terms of Service / ©2023