There are a lot of various trading systems on the internet, but most of them are unusable and mainly not profitable in the long term. For this reason, I would like to introduce my (proven and profitable) trading system utilizing the S / R zones.
I can definitely recommend the system to everyone, because it is very simple, but a very very profitable!
It's just amazing how so simple trading system can be profitable. So here the saying below is really true:
The system is built on a powerful indicator showing important S / R zones, which I found on the internet. So all credits go to the author. Over the years that I trade, I have not seen any better indicator on the S / R zones.
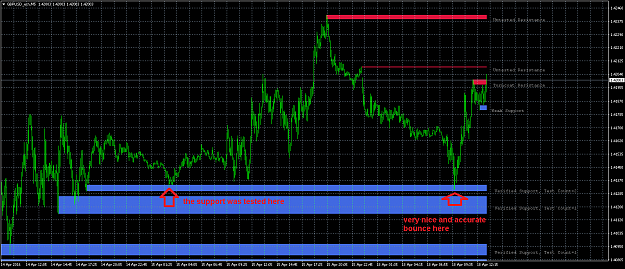
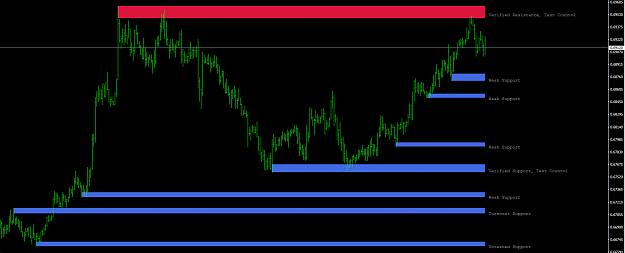
1) Firstly Id like to tell you more about the indicator for the important support and resistance zones, which I use in this system. The indicator shows the resistance and supports on the high quality price zones only. So the indicator doesnt draw a lot of the zones, but it draws only the imporant ones.
However, its main advantage is that it also shows us the quality of resistance and support zones. Or rather, how many times the market tested a given zone (S / R). Here, logically, the more times the market tested the zone, the zone will be stronger and more valid.
Settings of the indicator
The indicator has more settings, but the Factor and zone_extend are the most important for us:
a) Factor = how strong S / R zones should the indicator show (default 0.5)
b) zone_extend = whether the indicator should connect near S / R zones together (default false)
2) The whole trading system can be traded on any market and any timeframe (which is a big advantage). The lower the timeframe you choose, the more you will receive signals (more trades), but logically the trades will be shorter (faster opened and closed). It is up to every trader to choose the trading style that suits him.
The trading system is very simple and consists in the search for strong S / R levels (those which have been tested by the market at least once, but ideally 2 to 3 times).
Once the price hits the strong S / R zone (previously tested by the market), I open a trading position against the direction of the market (I use limit orders). Then I hold the trade until the price reaches the opposite S / R zone.
Buy trade:
Price reaches the strong support (must be tested at least once). At that moment, I am opening the buy trade. I set TP below the closest resistance. The SL is the same amount of pips from the entry price as TP - so I simply use RRR ratio 1 : 1.
Sell trade:
Price reaches the strong resistance (must be tested at least once). At that moment, I am opening the sell trade. I set TP above the nearest support. The SL is the same amount of pips from the entry price as TP - again, I simply use the 1 : 1 RRR ratio.
Final info:
The indicator shows only the strong S / R zones. Not like other S / R indicators, which are drawing S / R zones everywhere That's why I like the indicator a lot, and I also recommend you to zoom out the chart little bit to see all zones. For intraday trading, I recommend to choose M5 or M1 chart. For swing trading I like H1 chart the most.
With this indicator, of course, you can trade any other trading system. The system described above is only my the most simple variation of the system. I also trade the previously untested S / R zones, but this style is much difficult and requires more experience (I will show also a couple of these trades in this thread). Of course, if you will change the trading strategy, its 100% up to you.
I have also my second thread here (http://www.forexfactory.com/showthread.php?t=586713). These are currently my two the best, most useful and profitable trading systems. I will keep watching and posting to both threads.
Coop
I can definitely recommend the system to everyone, because it is very simple, but a very very profitable!
It's just amazing how so simple trading system can be profitable. So here the saying below is really true:
QuoteDislikedSimplicity is the ultimate sophistication (Leonardo da Vinci)
The system is built on a powerful indicator showing important S / R zones, which I found on the internet. So all credits go to the author. Over the years that I trade, I have not seen any better indicator on the S / R zones.
1) Firstly Id like to tell you more about the indicator for the important support and resistance zones, which I use in this system. The indicator shows the resistance and supports on the high quality price zones only. So the indicator doesnt draw a lot of the zones, but it draws only the imporant ones.
However, its main advantage is that it also shows us the quality of resistance and support zones. Or rather, how many times the market tested a given zone (S / R). Here, logically, the more times the market tested the zone, the zone will be stronger and more valid.
Attached File(s)
Attached Image (click to enlarge)
Settings of the indicator
The indicator has more settings, but the Factor and zone_extend are the most important for us:
a) Factor = how strong S / R zones should the indicator show (default 0.5)
b) zone_extend = whether the indicator should connect near S / R zones together (default false)
2) The whole trading system can be traded on any market and any timeframe (which is a big advantage). The lower the timeframe you choose, the more you will receive signals (more trades), but logically the trades will be shorter (faster opened and closed). It is up to every trader to choose the trading style that suits him.
The trading system is very simple and consists in the search for strong S / R levels (those which have been tested by the market at least once, but ideally 2 to 3 times).
Once the price hits the strong S / R zone (previously tested by the market), I open a trading position against the direction of the market (I use limit orders). Then I hold the trade until the price reaches the opposite S / R zone.
Buy trade:
Price reaches the strong support (must be tested at least once). At that moment, I am opening the buy trade. I set TP below the closest resistance. The SL is the same amount of pips from the entry price as TP - so I simply use RRR ratio 1 : 1.
Sell trade:
Price reaches the strong resistance (must be tested at least once). At that moment, I am opening the sell trade. I set TP above the nearest support. The SL is the same amount of pips from the entry price as TP - again, I simply use the 1 : 1 RRR ratio.
Final info:
The indicator shows only the strong S / R zones. Not like other S / R indicators, which are drawing S / R zones everywhere
With this indicator, of course, you can trade any other trading system. The system described above is only my the most simple variation of the system. I also trade the previously untested S / R zones, but this style is much difficult and requires more experience (I will show also a couple of these trades in this thread). Of course, if you will change the trading strategy, its 100% up to you.
I have also my second thread here (http://www.forexfactory.com/showthread.php?t=586713). These are currently my two the best, most useful and profitable trading systems. I will keep watching and posting to both threads.
Coop