Hello everyone, Its been a while since I have posted but I wanted to share a super simple system that has been proven profitable. I hope this will help some of you here on FF. I did not create this strategy and it is nothing new. Its often overlooked because it's so simple but often times the simplest strategies can be the best. I have modified the original trading rules a little bit to rules that fit my trading style a little better.
DISCLAIMER: THIS IS NO GRAIL. I AM NOT CLAIMING THIS TO BE A HOLY GRAIL. THIS IS JUST A SYSTEM THAT WORKS, THAT IS ALL.
Things To Keep in Mind:
1. This is intended to be traded on Daily Charts. I will also post the results for other timeframes towards the bottom of the post(coming soon).
2. There is no Hard SL or TP to this system. I have not found any configurations using ATR or similar tools to place an SL & TP that improved the system. As a result I do not use one with this system and just following the signals.
3. This system is not perfect. As with all systems, it performs better on certain pairs during certain conditions. What really allows you to take advantage of the system and avoid this variance is diversifying the instruments you trade it on!!!
4. Test results used a fixed lot size that does not increase.
5. Tests were performed on 7 major USD pairs(EU, GU, AU, NU, UJ, UCHF, UCAD).
Thread Rules:
1. Do not add additional indicators. You may adjust current indicator settings and share your results if you'd like.
2. If you are going to suggest changes to the system, please provide hard evidence to support why these changes are profitable or better.
3. Keep it friendly. Please no spam.
4. Again no one likes conjecture. Do not make statements or claims about this system or any other system in here if you do not provide proof for the claims you are making.
5. Have fun & keep learning!
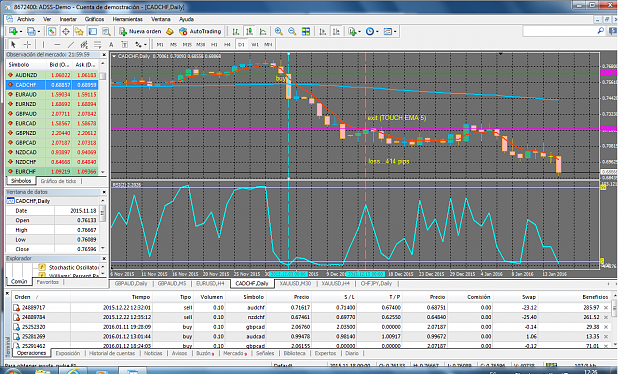
Entry Rules:
Long:
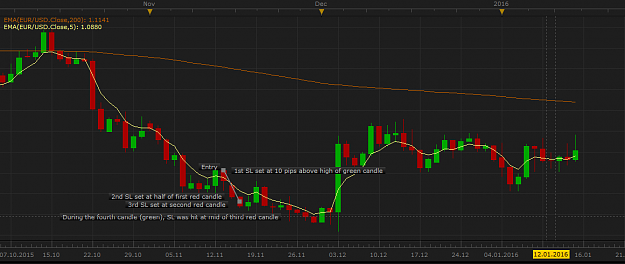
1. Price is above 200 MA.
2. Price is below 5 MA.
3. RSI(2) is below 5.
Short:
1. Price is below 200 MA.
2. Price is above 5 MA.
3. RSI(2) is above 95.
Exit Rules:
Option 1(This option is for people who just want to check the chart at the end of the day, This is the Option used in results below):
Exit at the close of the candle that touches the 5 ma.
Option 2(This is a better option for people who want to watch their trades like a hawk):
Exit as soon as price touches 5 ma.
So as they say, the proof is in the pudding. Well, here is my pudding, along with some other peoples pudding.
The Pudding:
In House Pudding:
The first batch of pudding I will show you is my batch. Although there are other studies done about this system which I will share below, it is always smart to test the system for yourself before you even think about using it.
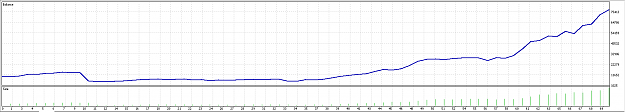
EURUSD Daily Jan 2010 - Dec 2015 - Fixed .10 Lots - Spread = Current(Tests ran during NY Session)
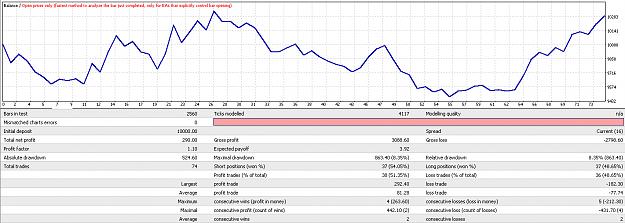
Summary:
P/L: 290.00
Profit Factor: 1.10
Expected Payoff: 3.92
Max DD: 8.35%
GBPUSD Daily Jan 2010 - Dec 2015 - Fixed .10 Lots - Spread = Current(Tests ran during NY Session)
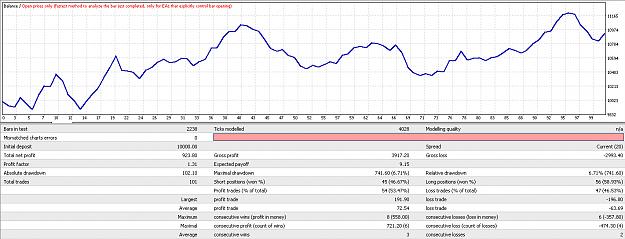
Summary:
P/L: 923.80
Profit Factor: 1.31
Expected Payoff: 9.15
Max DD: 6.71%
AUDUSD Daily Jan 2010 - Dec 2015 - Fixed .10 Lots - Spread = Current(Tests ran during NY Session)
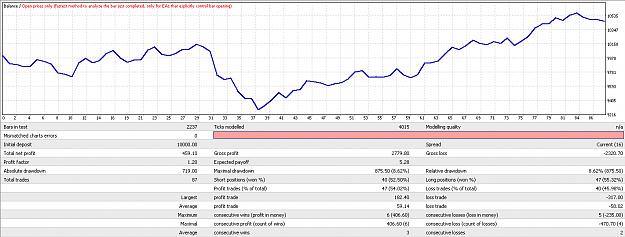
Summary:
P/L: 459.10
Profit Factor: 1.20
Expected Payoff: 5.28
Max DD: 8.62%
NZDUSD Daily Jan 2010 - Dec 2015 - Fixed .10 Lots - Spread = Current(Tests ran during NY Session)
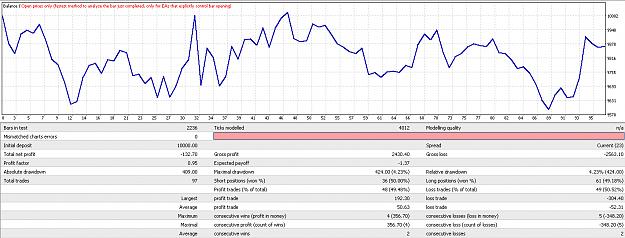
Summary:
P/L: (132.70)
Profit Factor: 0.95
Expected Payoff: (1.37)
Max DD: 4.23%
USDJPY Daily Jan 2010 - Dec 2015 - Fixed .10 Lots - Spread = Current(Tests ran during NY Session)
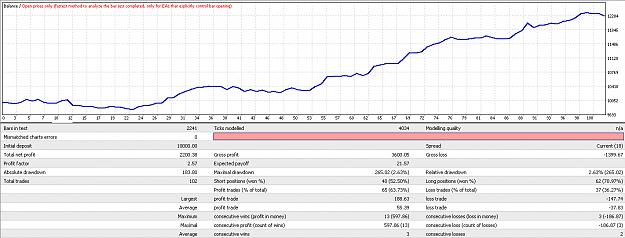
Summary:
P/L: 2200.83
Profit Factor: 2.57
Expected Payoff: 21.57
Max DD: 2.63%
USDCHF Daily Jan 2010 - Dec 2015 - Fixed .10 Lots - Spread = Current(Tests ran during NY Session)
Summary:
P/L: 61.42
Profit Factor: 1.02
Expected Payoff: 0.65
Max DD: 6.86%
USDCAD Daily Jan 2010 - Dec 2015 - Fixed .10 Lots - Spread = Current(Tests ran during NY Session)
Summary:
P/L: 80.29
Profit Factor: 1.04
Expected Payoff: 0.80
Max DD: 5.90%
OVERALL RESULTS
P/L: 3882.74(38.82%)
Avg Profit Factor: 1.31
Avg Expected Payoff: 5.71
Avg MAX DD: 6.19%
Summary:
Overall this system performed quite well over the last 5 years. As I mentioned above it is key to diversify when using this strategy or others like it because some pairs will perform others as market conditions change. Diversifying will combat this variance as shown in the results above.
Out Sourced Pudding:
Summary:
As you can also see from these results, diversifying really helps this system by reducing the natural variance that will occur between individual pair performance.
DISCLAIMER: THIS IS NO GRAIL. I AM NOT CLAIMING THIS TO BE A HOLY GRAIL. THIS IS JUST A SYSTEM THAT WORKS, THAT IS ALL.
Things To Keep in Mind:
1. This is intended to be traded on Daily Charts. I will also post the results for other timeframes towards the bottom of the post(coming soon).
2. There is no Hard SL or TP to this system. I have not found any configurations using ATR or similar tools to place an SL & TP that improved the system. As a result I do not use one with this system and just following the signals.
3. This system is not perfect. As with all systems, it performs better on certain pairs during certain conditions. What really allows you to take advantage of the system and avoid this variance is diversifying the instruments you trade it on!!!
4. Test results used a fixed lot size that does not increase.
5. Tests were performed on 7 major USD pairs(EU, GU, AU, NU, UJ, UCHF, UCAD).
Thread Rules:
1. Do not add additional indicators. You may adjust current indicator settings and share your results if you'd like.
2. If you are going to suggest changes to the system, please provide hard evidence to support why these changes are profitable or better.
3. Keep it friendly. Please no spam.
4. Again no one likes conjecture. Do not make statements or claims about this system or any other system in here if you do not provide proof for the claims you are making.
5. Have fun & keep learning!
Entry Rules:
Long:
1. Price is above 200 MA.
2. Price is below 5 MA.
3. RSI(2) is below 5.
Short:
1. Price is below 200 MA.
2. Price is above 5 MA.
3. RSI(2) is above 95.
Exit Rules:
Option 1(This option is for people who just want to check the chart at the end of the day, This is the Option used in results below):
Exit at the close of the candle that touches the 5 ma.
Option 2(This is a better option for people who want to watch their trades like a hawk):
Exit as soon as price touches 5 ma.
So as they say, the proof is in the pudding. Well, here is my pudding, along with some other peoples pudding.
The Pudding:
In House Pudding:
The first batch of pudding I will show you is my batch. Although there are other studies done about this system which I will share below, it is always smart to test the system for yourself before you even think about using it.
EURUSD Daily Jan 2010 - Dec 2015 - Fixed .10 Lots - Spread = Current(Tests ran during NY Session)
Attached Image (click to enlarge)
Summary:
P/L: 290.00
Profit Factor: 1.10
Expected Payoff: 3.92
Max DD: 8.35%
GBPUSD Daily Jan 2010 - Dec 2015 - Fixed .10 Lots - Spread = Current(Tests ran during NY Session)
Attached Image (click to enlarge)
Summary:
P/L: 923.80
Profit Factor: 1.31
Expected Payoff: 9.15
Max DD: 6.71%
AUDUSD Daily Jan 2010 - Dec 2015 - Fixed .10 Lots - Spread = Current(Tests ran during NY Session)
Attached Image (click to enlarge)
Summary:
P/L: 459.10
Profit Factor: 1.20
Expected Payoff: 5.28
Max DD: 8.62%
NZDUSD Daily Jan 2010 - Dec 2015 - Fixed .10 Lots - Spread = Current(Tests ran during NY Session)
Attached Image (click to enlarge)
Summary:
P/L: (132.70)
Profit Factor: 0.95
Expected Payoff: (1.37)
Max DD: 4.23%
USDJPY Daily Jan 2010 - Dec 2015 - Fixed .10 Lots - Spread = Current(Tests ran during NY Session)
Attached Image (click to enlarge)
Summary:
P/L: 2200.83
Profit Factor: 2.57
Expected Payoff: 21.57
Max DD: 2.63%
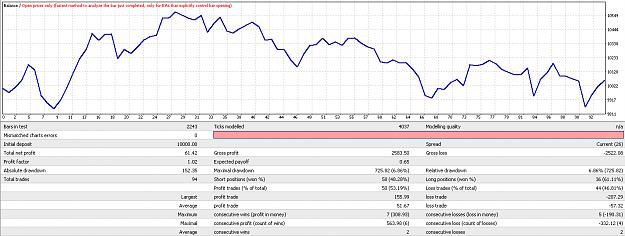
USDCHF Daily Jan 2010 - Dec 2015 - Fixed .10 Lots - Spread = Current(Tests ran during NY Session)
Attached Image (click to enlarge)
Summary:
P/L: 61.42
Profit Factor: 1.02
Expected Payoff: 0.65
Max DD: 6.86%
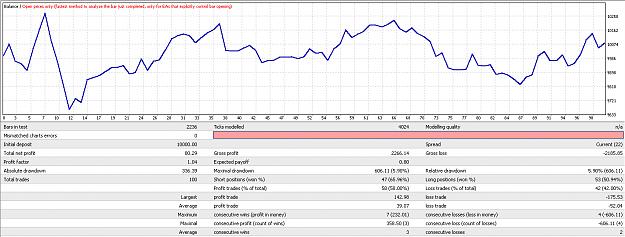
USDCAD Daily Jan 2010 - Dec 2015 - Fixed .10 Lots - Spread = Current(Tests ran during NY Session)
Attached Image (click to enlarge)
Summary:
P/L: 80.29
Profit Factor: 1.04
Expected Payoff: 0.80
Max DD: 5.90%
OVERALL RESULTS
P/L: 3882.74(38.82%)
Avg Profit Factor: 1.31
Avg Expected Payoff: 5.71
Avg MAX DD: 6.19%
Summary:
Overall this system performed quite well over the last 5 years. As I mentioned above it is key to diversify when using this strategy or others like it because some pairs will perform others as market conditions change. Diversifying will combat this variance as shown in the results above.
Out Sourced Pudding:
Attached File(s)
Summary:
As you can also see from these results, diversifying really helps this system by reducing the natural variance that will occur between individual pair performance.