No problem on the EMA change. I will repost EA with change. But with using the FX Sniper or reverse cross of the 5/9 MA to close orders, there is quite often reverse cross too early to take max profit on the trend. The EA uses it own code to calculate dot value, which is value 1 or -1. So, refresh to the chart will have no effect on EA. The chart paints dots from the attached SHI-SilverTrendSIG indicator.
I will look at other possible reverse signals. Any suggestions is appreciated.
Wackena
Ignored
Attached is modified EA. I still not sure it is operating correctly. I need to see more how it opens and closes orders. So, at present use with caution.
You mean 1.2 % of Your account ? Thanks for all of this info.! I really appreciate it !
Thank You, Dan.
Ignored
Youuuuuu got it. I have a spreadsheet that projects a yearly income if I set a goal of X number of pips per week and setting percent of account used. You don't have to risk that much to make a living. I am in a time crunch now but will post later some other thoughts of money management.
Also, Dan, could you put your questions outside the quote box so I can quote you easier. This helps others reading to know what question I am answering. Thanks
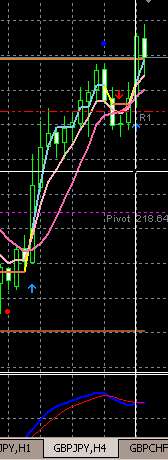
Here is what happened with my GBP/JPY short trade last night. Entered according to the signals, the price went the oppsite direction, which is not unexpected.
However, what confused me a quite bit is that the opposite dot of the trend reversal (i.e. red in my case) had never showed up i.e. even after 100 pips from my entry point (i.e. my entry was at 219.67, and the price went up all the way to 220.67).
Could please someone explain this phenomena?
Thank you in advance
The GBP/JPY is a very volitile pair. It does not respect Pivots, fibs or s and r the way other pairs do.
Ignored
Thanks a lot for your respond, MissForex, but my question was about the algorithm the script functions by, not this particular pair. What I am curious about is how come such huge move ended up undetected/ignored by the script i.e. didn't trigger the opposite dot, indicating the trend reversal, to show up.
No problem on the EMA change. I will repost EA with change. But with using the FX Sniper or reverse cross of the 5/9 MA to close orders, there is quite often reverse cross too early to take max profit on the trend. The EA uses it own code to calculate dot value, which is value 1 or -1. So, refresh to the chart will have no effect on EA. The chart paints dots from the attached SHI-SilverTrendSIG indicator.
I will look at other possible reverse signals. Any suggestions is appreciated.
Here is what happened with my GBP/JPY short trade last night. Entered according to the signals, the price went the oppsite direction, which is not unexpected.
However, what confused me a quite bit is that the opposite dot of the trend reversal (i.e. red in my case) had never showed up i.e. even after 100 pips from my entry point (i.e. my entry was at 219.67, and the price went up all the way to 220.67).
Could please someone explain this phenomena?
Thank you in advance
Ignored
Here is my chart that does not show the dot and cross that you took. I was in a trade the other day and I swore I was trading a signal but when I came back my stop was hit and I couldn't figure out why I got in. I will take pics of charts on each trade now to make sure I do not imagine something.
My chart may look different because the data come from InterbankFX. Where does your data come from?
i was following also gbpjpy and i got that trade.
the dots moved.
I was following it all the time for all day yesterday. i trade with fxdd platform mt4.
i send u screenshot. i had the cross and the dot that u see now on the screenshot is no the first dot I saw. the dot I saw and made me enter short was 3 bars before, right on the cross(where is arrow green, there was dot) which then changed
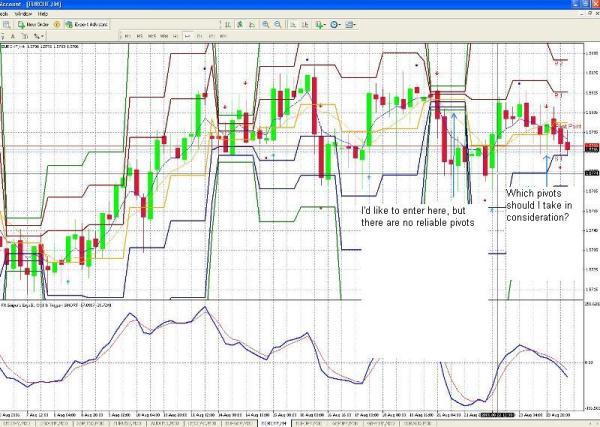
Can anybody explain why do my pivots look like this?
I'm confused:
1. In the first case the pivots are too close, so they are don't really helpfull.
2. In the second case they change in one or two candles, so I don't know which one to pick in the trade time, and If I have to change the SL and TP based on pivots, when a pivot line changes direction.
The name of the indicator is simply "pivot" (included in the package od 250 or 450 indicators, that I've found on FF)
Under TF options of the indicator I've selecet "all timeframes" mostly, because If i choose a single timeframe, there are no pivots on the chart, or simply only the names of the pivot lines appear, but there are no lines.
Use this one instead, I have found it to be much clearer. I must tell you that you should really look at FIBS as resistance and support. They are much better (for me) than pivots. I've attached both indicators for your use. For more info on how to use the Vegas FIBS, you can go to the downloads section of this website: www.tunneltrading.com
Hope this helps, and all the best,
forexpips
Quoting opti
Disliked
Can anybody explain why do my pivots look like this?
I'm confused:
1. In the first case the pivots are too close, so they are don't really helpfull.
2. In the second case they change in one or two candles, so I don't know which one to pick in the trade time, and If I have to change the SL and TP based on pivots, when a pivot line changes direction.
The name of the indicator is simply "pivot" (included in the package od 250 or 450 indicators, that I've found on FF)
Under TF options of the indicator I've selecet "all timeframes" mostly, because If i choose a single timeframe, there are no pivots on the chart, or simply only the names of the pivot lines appear, but there are no lines.
Thanks a lot for your respond, MissForex, but my question was about the algorithm the script functions by, not this particular pair. What I am curious about is how come such huge move ended up undetected/ignored by the script i.e. didn't trigger the opposite dot, indicating the trend reversal, to show up.
Ignored
Here are attached GBP/JPY on two TimeFrames (H4 & H1). The red dot on H1 is below the visual zone, but it is there.
The longer is watch/test this method the more I am convinced that trading from dot to dot would be the most efficient way to trade it. Stop loss 10 pips above/below the highest/lovest bar of the previous move.
Here is a question to Wakena. How should I change the code to do just that?
btw, until now I never trusted any automated trading EA, this is the very first one, that I trust enough to test while trading in the real environment.
My questions regarding your expert advisor are as follows :
1. Does the EA automatically repaint the dots after the next bar opens ?
2. If you watch the dots carefully you can notice, that the dots don't
jump to the next bar on the opening on a new one.
The dots stay at their place !!
So if the dots don't jump after the opening of a new bar it
will be a good indication, that the trend has reached a top / bottom.
Can you implement this in your bogie EA ??
I'm trying to attach tlatomi beta 1.0a EA to a chart.
Could you tell me how to properly download this EA and then how to get it running on a chart?
I can download indicators easily and use them, but i'm having trouble getting EA's up and running.
And another thing, does the tlatomi beta 1.0a EA repaint itself in real time when used?
Thanks.
Ignored
paddyman,
1. download EA and place in Metatrader 4 Experts folder (not Indicators folder).
2. open EA with MetaEditor and Compile EA.
3. You should now see EA in Expert Advisors folder in the MetaTrader. Drag EA onto chart.