Good afternoon friends!
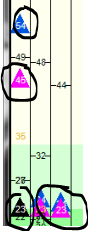
I am having difficulty with the indicator below. I wonder how can I replace the lines of fibonacci to show the price on the grid instead of a bar (-) and replacing the MA's also the price, rather than appeared a thicker bar (_).
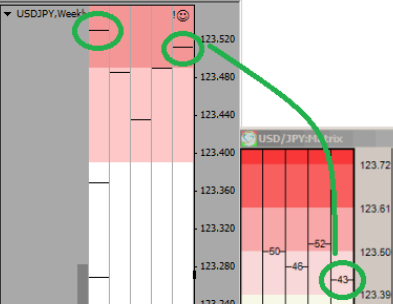
I highlighted in red in the window above where maybe it could be the key to the "problem", what do you think? someone with a better understanding could help me?
I am having difficulty with the indicator below. I wonder how can I replace the lines of fibonacci to show the price on the grid instead of a bar (-) and replacing the MA's also the price, rather than appeared a thicker bar (_).
Attached Image
Inserted Code
//  Dynamic Fibonacci Grid v1.1   (levels only)
//--------------------------------------------------------------
#property indicator_chart_window
extern int    Shift        = -97;
extern int    Spacing      = 20;
extern int    Width        = 19;
extern int    MA_mode      = 0;
#define NSL    10       // number of shade levels
#define NMA    7       // number of MAs, change ma_period[NMA-1] accordingly
#define NTF    5       // number of time frames/lanes, change tfp[NTF] accordinlgy
double   fml[NTF][NMA];                                    // momentum lines
double   bsl_up[NTF][NSL];                                 // color shades levels to the up side
double   bsl_down[NTF][NSL];                               // color shades levels to the down side
double   bsl[NSL];                                         // color shades distances ('point' adjusted)
double   srl[28];                                          // support/resistance levels (total = 2*NSL + NMA + 1(Bid) )
double   price, point;
double   tmpArray[NMA], lowestMA, highestMA;
int      srgap, tfc, mac;                                  // color shades distances
int      _bsl[NSL]    = {10, 16, 26, 42, 68, 111, 179, 290, 470, 760}; // time shades distance
int      ma_period[7] = {21,34,55,75,100,144,233};         // SMAs, NMA-1
int      tfp[NTF]     = {1,5,15,60,240};                       // Time frames/lanes - in minutes. Like H4=240, D1=1440 etc...
int      counted_bars, startBar, bar, i, y;
int      tf, c, offset, xUnit;
int      shift, spacing, width, supports, resistances;
//color    Shade[NSL]    = {C'220,240,255', C'180,210,255', C'140,180,255', C'100,150,255', C'60,120,255', C'20,90,255', C'0,60,255', C'0,40,225', C'0,30,200'};
color    col, macolor;
string   objName, dir, MA, name;
string   uniqueid = "FXG: ";
datetime curTime;
//+------------------------------------------------------------------+
//| Custom indicator initialization function                         |
//+------------------------------------------------------------------+
int init()
{
   xUnit   = Period() * 60;
   shift   = Shift * xUnit;
   spacing = Spacing * xUnit;
   width   = Width * xUnit;
   point   = 0.01;
   if(Digits > 3) point = 0.0001;
//+------------------------------------------------------------------+
//| creating the objects for drawing the grid                        |
//+------------------------------------------------------------------+
   for(i=0; i<NSL; i++)  bsl[i] = _bsl[i]*point;
   for(tf=0; tf<NTF; tf++)
   {
      for(i=0; i<NSL; i++)
      {

         [color=red]objName = uniqueid+"bsl_up_bar_"+tf+"_"+i;           // upper zone separator lines[/color]

[color=red]         ObjectCreate(objName, OBJ_TREND, 0, 0, 0, 0, 0);[/color]
[color=red]            ObjectSet(objName, OBJPROP_COLOR, clrBlack);[/color]
[color=red]            ObjectSet(objName, OBJPROP_RAY, false);[/color]
[color=red]            ObjectSet(objName, OBJPROP_WIDTH, 1);[/color]
[color=red]            ObjectSet(objName, OBJPROP_STYLE, 0);[/color]

        [color=red] objName = uniqueid+"bsl_down_bar_"+tf+"_"+i;         // lower zone separator lines[/color]

[color=red]         ObjectCreate(objName, OBJ_TREND, 0, 0, 0, 0, 0);[/color]
[color=red]            ObjectSet(objName, OBJPROP_COLOR, clrBlack);[/color]
[color=red]            ObjectSet(objName, OBJPROP_RAY, false);[/color]
[color=red]            ObjectSet(objName, OBJPROP_WIDTH, 1);[/color]
[color=red]            ObjectSet(objName, OBJPROP_STYLE, 0);[/color]
      }
      for(i=0; i<NMA; i++)
      {
         [color=red]objName = uniqueid + "fml_bar_" + tf + "_" + i;              // horizontal momentum lines[/color]

[color=red]         ObjectCreate(objName, OBJ_TREND, 0, 0, 0, 0, 0);[/color]
[color=red]            ObjectSet(objName, OBJPROP_COLOR, Black);[/color]
[color=red]            ObjectSet(objName, OBJPROP_RAY, false);[/color]
[color=red]            ObjectSet(objName, OBJPROP_WIDTH, 1);[/color]
[color=red]         if(i<2 || i == NMA-1)[/color]
[color=red]            ObjectSet(objName, OBJPROP_WIDTH, 3);[/color]
      }
   }
   return(0);
}
//+------------------------------------------------------------------+
//| Custom indicator deinitialization function                       |
//+------------------------------------------------------------------+
int deinit()
{
   string lookFor       = uniqueid;
   int    lookForLength = StringLen(lookFor);
   for(int i = ObjectsTotal() - 1; i >= 0; i--)
   {
      string name = ObjectName(i);
         if(StringSubstr(name, 0, lookForLength) == lookFor) ObjectDelete(name);
   }
   return(0);
}
//+------------------------------------------------------------------+
//| Custom indicator iteration function                              |
//+------------------------------------------------------------------+
int start()
{
   point   = 0.01;
   if(Digits > 3) point = 0.0001;
//+------------------------------------------------------------------+
//| Time lines                                                       |
//+------------------------------------------------------------------+
   curTime = Time[0];
   price   = Close[0];

   for(tf=0; tf<NTF; tf++)
   {
      bar = iBarShift(NULL, tfp[tf], curTime, false);
      for(i=0; i<NMA; i++)  fml[tf][i] = iMA(NULL, tfp[tf], ma_period[i], 0, MA_mode, PRICE_CLOSE, bar/Period());  // populating the fml array...
      for(i=0; i<NMA; i++) tmpArray[i] = fml[tf][i];                                                               // finding the highest and lowest MAs from the (7) fml's/MA's
      ArraySort(tmpArray);                                                                                         // copying the MAs levels of this TF to one dim array to feed ArrayBsearch
         lowestMA  = tmpArray[0];
         highestMA = tmpArray[6];
      for(i=0; i<NSL; i++)                                                                                         // populating the bsl arrays...
      {
         bsl_up[tf][i]   = lowestMA  + bsl[i];
         bsl_down[tf][i] = highestMA - bsl[i];
      }
   }
//+------------------------------------------------------------------+
//| drawing the color shades of the grid from top to bottom          |
//+------------------------------------------------------------------+
   for(tf=0; tf<NTF; tf++)
   {
      offset = 0;                                                                // find the number of overlapping shades
      for(i=offset; i<NSL-1; i++) if(bsl_up[tf][i] <= bsl_down[tf][i]) offset++;
      if(offset > 0)                                                             // hide first level objects' overlapping, so they wont be left as 'ghosts'      {
         objName = uniqueid+"bsl_up_bar_"+tf+"_"+(NSL-2-offset+1);
            ObjectSet(objName, OBJPROP_TIME1,  0);
            ObjectSet(objName, OBJPROP_TIME2,  0);
            ObjectSet(objName, OBJPROP_PRICE1, 0);
            ObjectSet(objName, OBJPROP_PRICE2, 0);
         objName = uniqueid+"bsl_down_bar_"+tf+"_"+(NSL-2-offset+1);
            ObjectSet(objName, OBJPROP_TIME1,  0);
            ObjectSet(objName, OBJPROP_TIME2,  0);
            ObjectSet(objName, OBJPROP_PRICE1, 0);
            ObjectSet(objName, OBJPROP_PRICE2, 0);
      }

      double highest=0;
      for(i=NSL-2; i>=offset; i--)
      {

         if (bsl_down[tf][i]>highest) highest=bsl_up[tf][i+1];

         objName = uniqueid+"bsl_up_bar_"+tf+"_"+(i-offset);
            ObjectSet(objName, OBJPROP_TIME1,  curTime+shift+tf*spacing);
            ObjectSet(objName, OBJPROP_TIME2,  curTime+shift+tf*spacing+width);
            ObjectSet(objName, OBJPROP_PRICE1, bsl_up[tf][i]);
            ObjectSet(objName, OBJPROP_PRICE2, bsl_up[tf][i]);

      }
      double lowest=9999.9999;
      for(i=0; i<NSL-1; i++)
      {

         if(bsl_down[tf][i]<lowest) lowest=bsl_down[tf][i+1];

         objName = uniqueid+"bsl_down_bar_"+tf+"_"+(i-offset);
            ObjectSet(objName, OBJPROP_TIME1,  curTime+shift+tf*spacing);
            ObjectSet(objName, OBJPROP_TIME2,  curTime+shift+tf*spacing+width);
            ObjectSet(objName, OBJPROP_PRICE1, bsl_down[tf][i]);
            ObjectSet(objName, OBJPROP_PRICE2, bsl_down[tf][i]);
      }
//+------------------------------------------------------------------+
//| drawing the momentum lines bars                                  |
//+------------------------------------------------------------------+
      for(i=0; i<NMA; i++)
      {
         objName = uniqueid + "fml_bar_" + tf + "_" + i;
            ObjectSet(objName, OBJPROP_TIME1,  curTime+shift+tf*spacing+xUnit);
            ObjectSet(objName, OBJPROP_TIME2,  curTime+shift+tf*spacing+width-xUnit);
            ObjectSet(objName, OBJPROP_PRICE1, fml[tf][i]);
            ObjectSet(objName, OBJPROP_PRICE2, fml[tf][i]);
         if(i==0)
         {
            if(fml[tf][i] >= price) col = clrBlue;
            else                    col = clrBlue;
            ObjectSet(objName, OBJPROP_COLOR, col);
         }
         if(i==1)
         {
            if(fml[tf][i] >= price) col = clrMagenta;
            else                    col = clrMagenta;
            ObjectSet(objName, OBJPROP_COLOR, col);
         }
      }
   }

return(0);
}
I highlighted in red in the window above where maybe it could be the key to the "problem", what do you think? someone with a better understanding could help me?
Attached File(s)
Best Regards! DaniP.