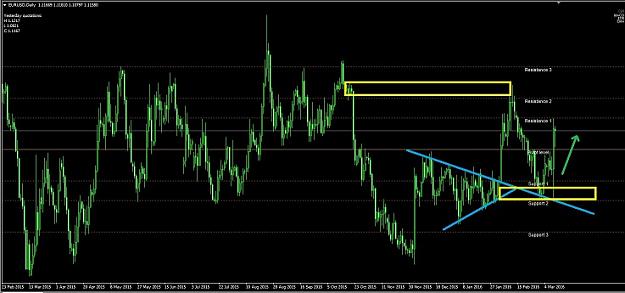
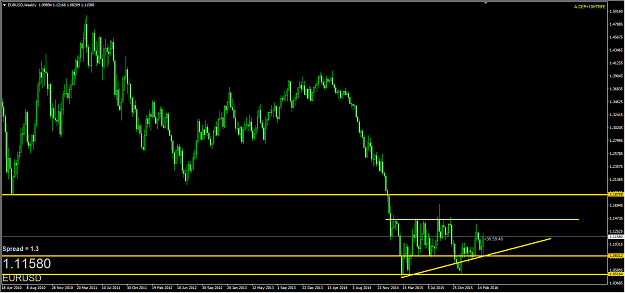
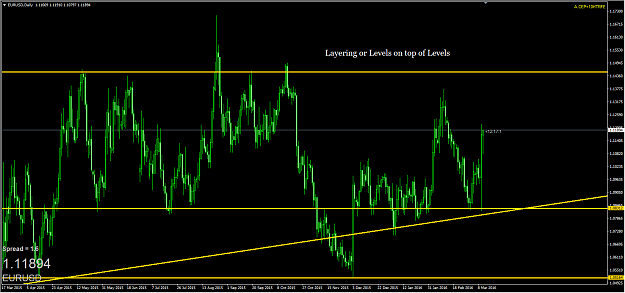
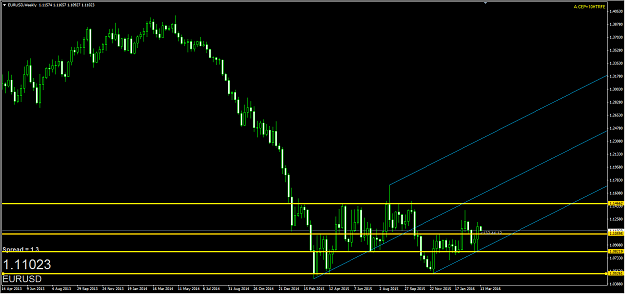
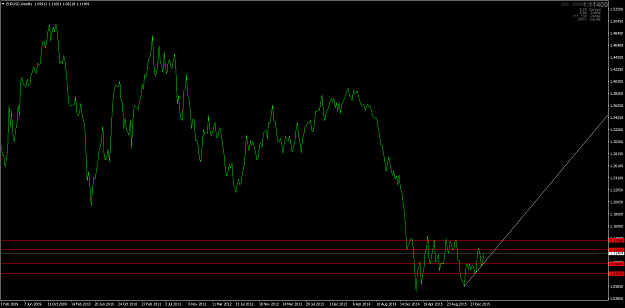
DislikedHere you see a linechart - EU weekly - linecharts in higher timeframes gives an extra clue for big turning points (TRENDCHANGE), remember that behind any level stands an "area" of S/R. If you switch then to bar /Candle charts in LTF you have a better overview , finding best levels as posible. Its nicely visible "123pattern" as randolf posted http://www.forexfactory.com/showthre...16#post8792416 this is just my experience over the years {image} trade well and nice weekend HPTIgnored
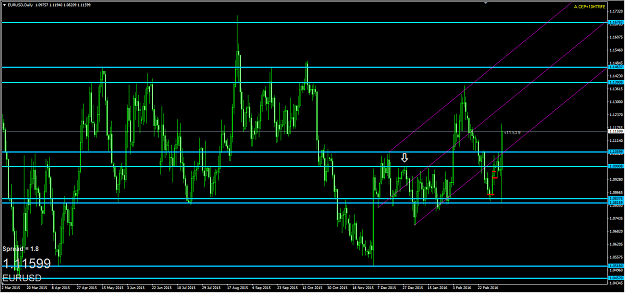
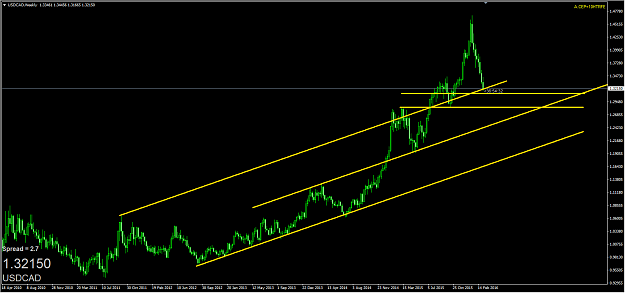
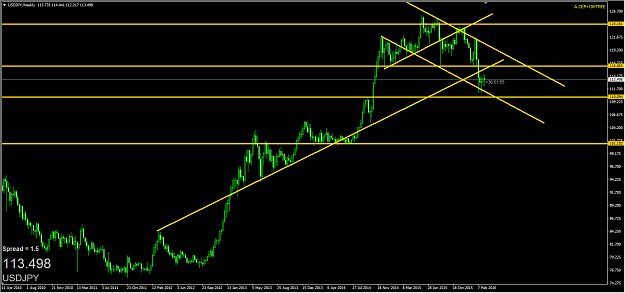
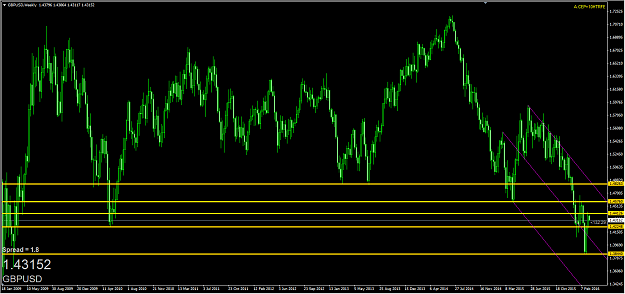
Weekly chart
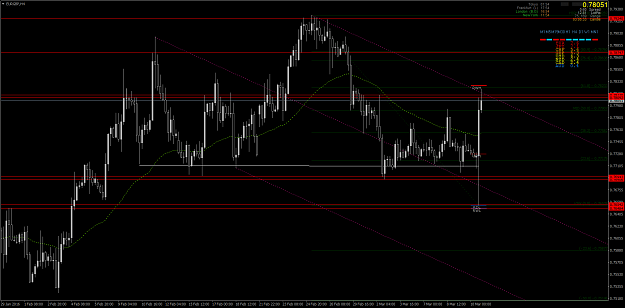
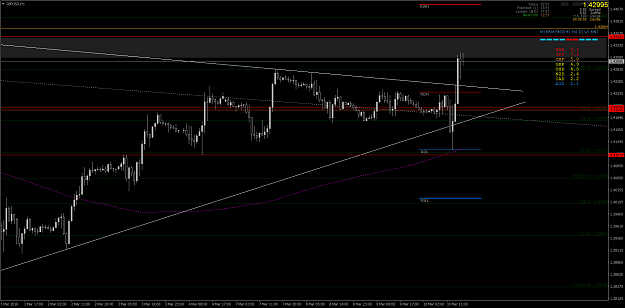
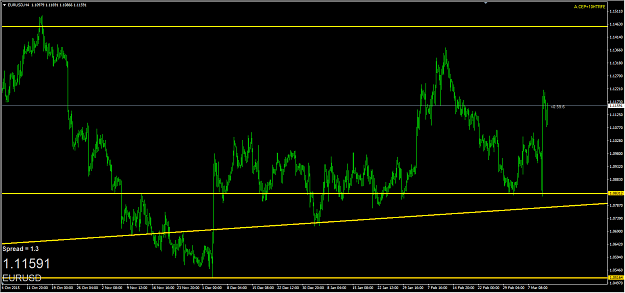
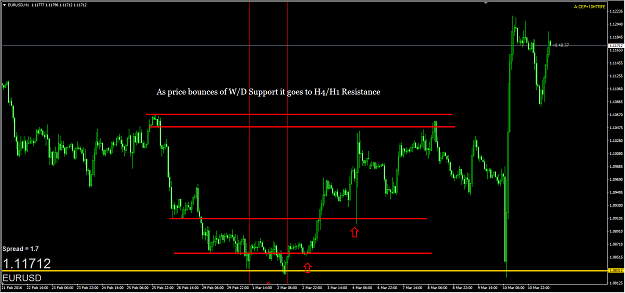
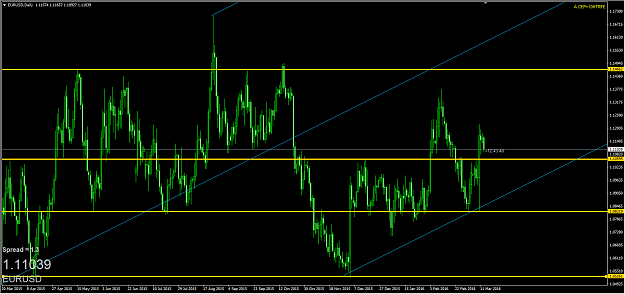
as expected EURUSD levels work fine tp 1.12
Attached Image (click to enlarge)
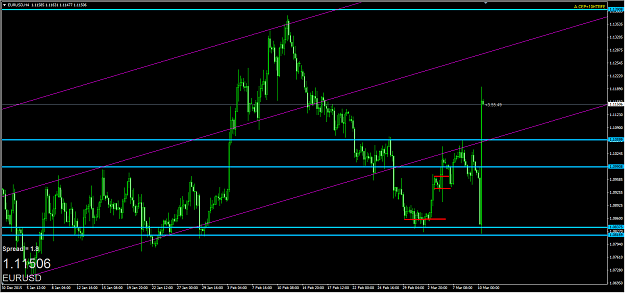
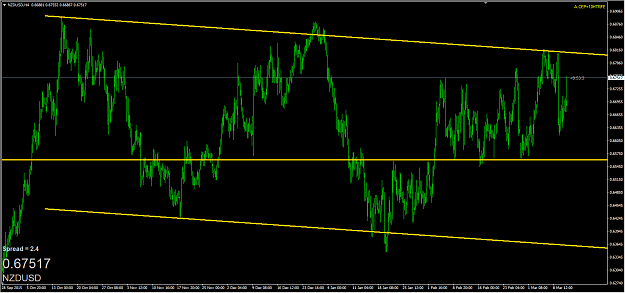
H4
Attached Image (click to enlarge)
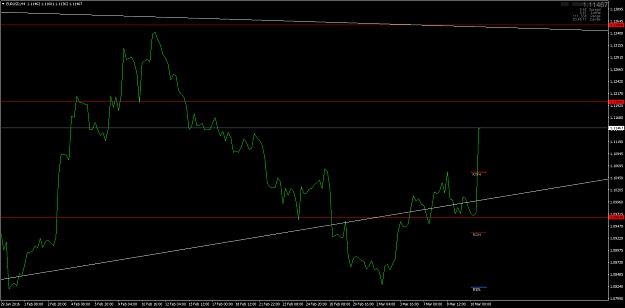
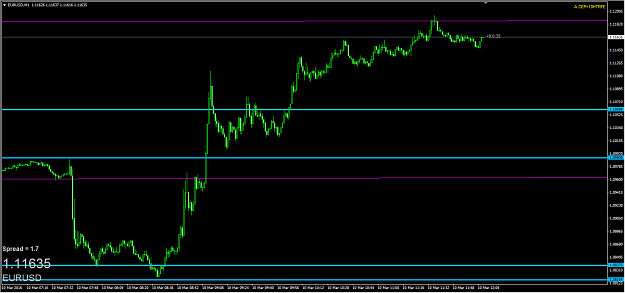
green pips
HPT
from level to level - you need mental strength to reach the summit