DislikedWelcome back Almuten! Question is, how would you know that the green HAC will hold and not be revisited? What about when the price is ranging and crossing the HACS back and forth, how would you know when the price will take off? Because I tend to keep an eye on only a few markets, and ranging happens a lot, but then the price just takes off, and I miss it!Ignored
The short answer: Nothing is ever certain.
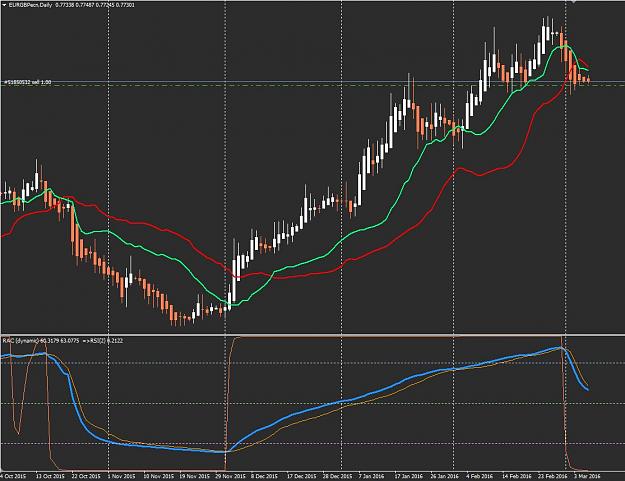
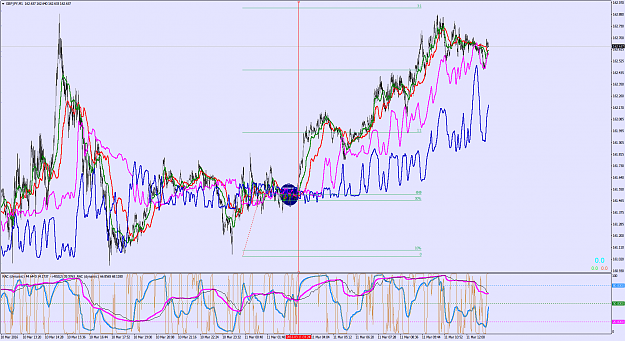
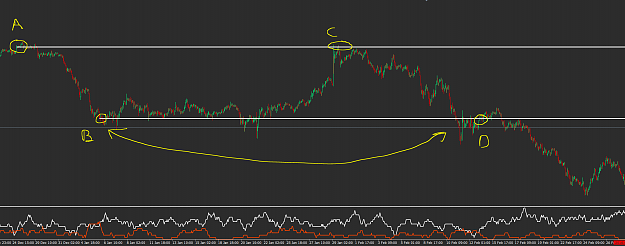
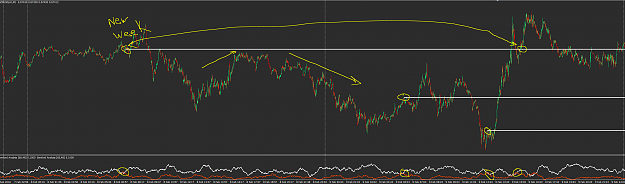
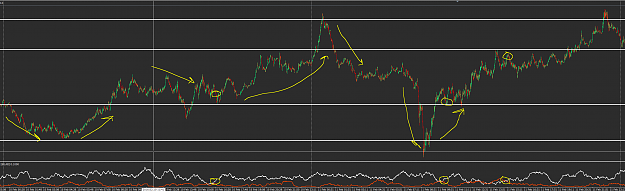
The long answer would be to look to the lower TFs and see how they're faring. For instance, when the M1 triggered, how many periods until the M5 triggered? Then how many periods before the M15? Next, is the green HAC on the H1 very close in price to the red on M15? If it's close or right on it, there will be H1 support/involvement. Same for the H1 red - how close is the H4 green? If it's close, then there will be H4 involvement and so on.
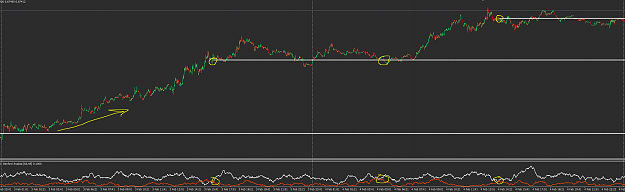
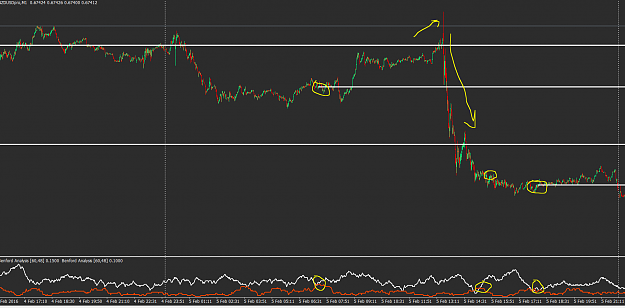
So let's say that you're interested in trading an H1 and the green line has just been crossed or is in the process of crossing. Look to the lower TFs and see what's going on. If it all looks good and tight and the M15 has plenty of room to 3x, the chances of H1 taking off sharply is very great - especially if the RAC is confirming or will realistically confirm it in the near future. If it's buried one way or the other (like flat above 90 or below 10), then it's likely going to come back on you. But I think this would be rare if the lower TFs are showing strong movement and the HAC lines are lined up from one TF to another.
The H1 red gets crossed an average of 11 times per month across all markets. Not all of them are great moves (obviously), but most of the bad ones can get filtered out by looking at the factors mentioned above.
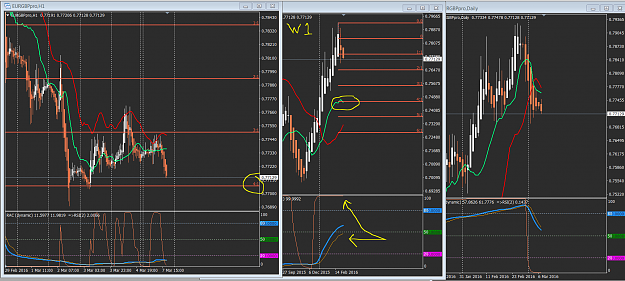
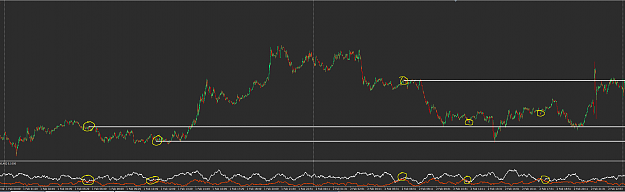
Many pairs trigger together or very close together as well. Generally there will be a leader among them and often they make identical patterns in the indicators. The HAC lines will make the same shapes and so on. This can be useful as well because when major currency rotations occur, there's less chance of them jacking around.