• Home
  • Forums
  • Trades
  • News
  • Calendar
  • Market
  • Brokers
  • Login
  • Join
  • User/Email: Password:
  • 8:00pm
Menu
  • Forums
  • Trades
  • News
  • Calendar
  • Market
  • Brokers
  • Login
  • Join
  • 8:00pm
Sister Sites
  • Metals Mine
  • Energy EXCH
  • Crypto Craft

Options

Bookmark Thread

First Page First Unread Last Page Last Post

Printable Version

Similar Threads

Plan the Trade / Trade the plan 74 replies

Plan the Trade and Trade the Plan: Swing Trading the Euro 5 replies

A realistic trade plan 6 replies

my trade plan for next week 47 replies

  • Trading Journals
  • /
  • Reply to Thread
  • Subscribe
  • 5,097
Attachments: Plan the Trade
Exit Attachments

Plan the Trade

  • Last Post
  •  
  • Page 1 23456 686
  • Page 1 2 686
  •  
  • Post #1
  • Quote
  • First Post: Edited Mar 16, 2016 1:01pm Mar 9, 2016 4:12am | Edited Mar 16, 2016 1:01pm
  •  The Cableguy
  • Joined Apr 2011 | Status: NQ eta moi lybov... | 3,030 Posts
Someone else has already started a 'Trade the Plan' thread, so i have shortened my preferred title!

I am combining a couple of systems, so i will try to explain as i go along, rather than list all criteria here in the title.

I am basing my trading method on a style i learnt from a brilliant trader with the handle 'Divergence'. He selflessly shares this method on a thread under 'Trading Systems', so whereas, i wanted to start a thread, i thought i would list it under 'Traders Journals' instead.

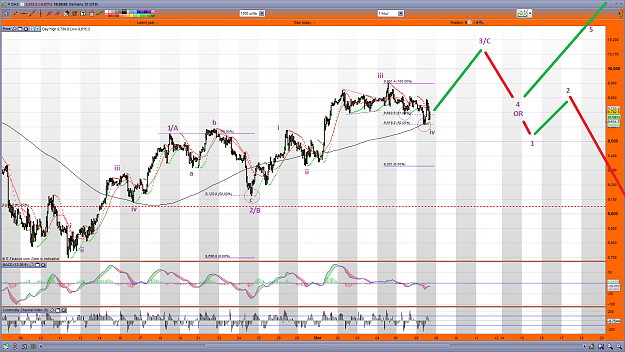
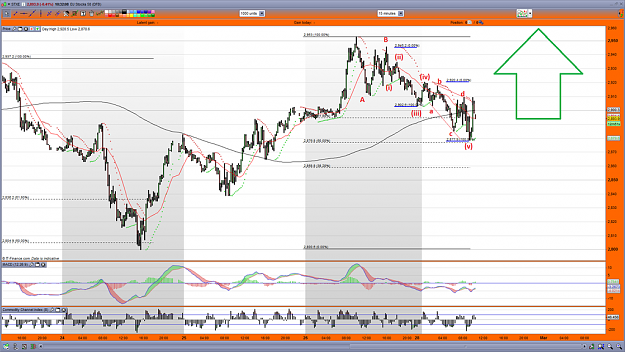
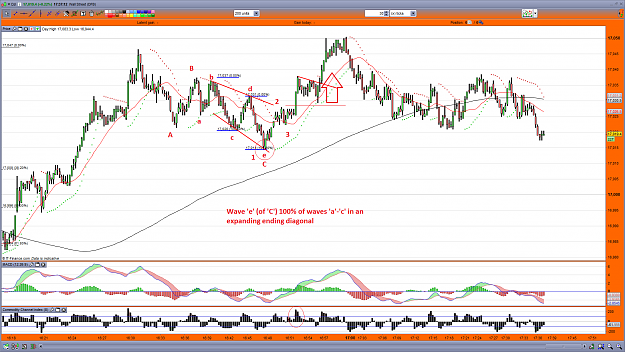
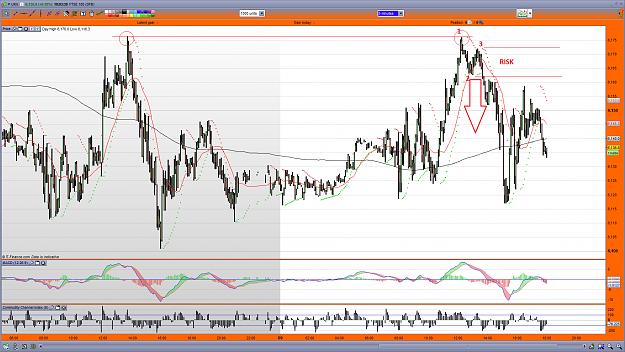
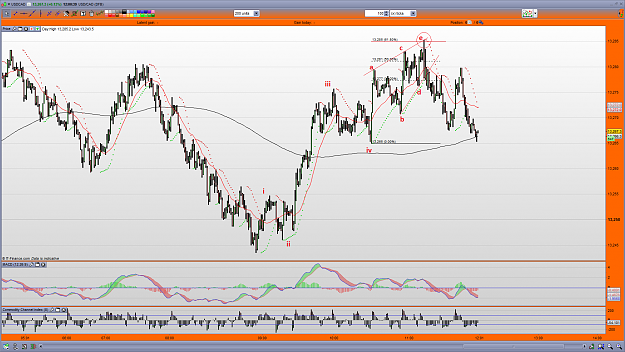
I will include some Elliott Wave work within my own style.

Two of the main variants that i will be looking for are the following;

Attached Image (click to enlarge)
Click to Enlarge

Name: tradeplan.png
Size: 45 KB


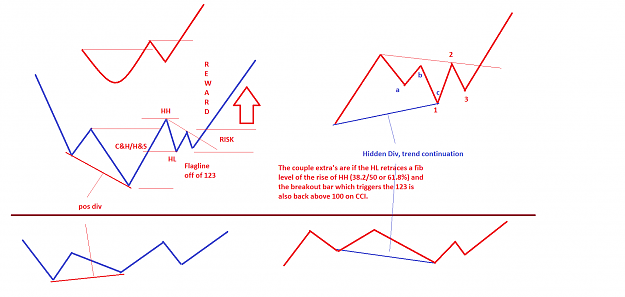
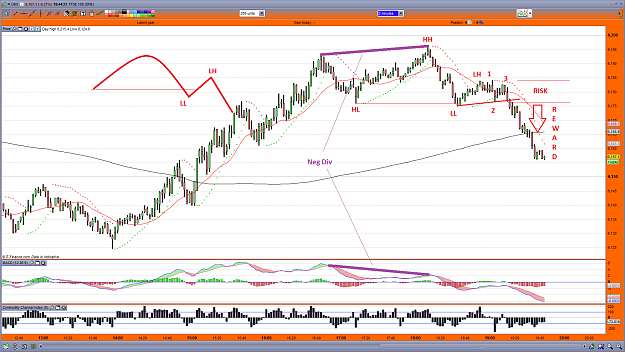
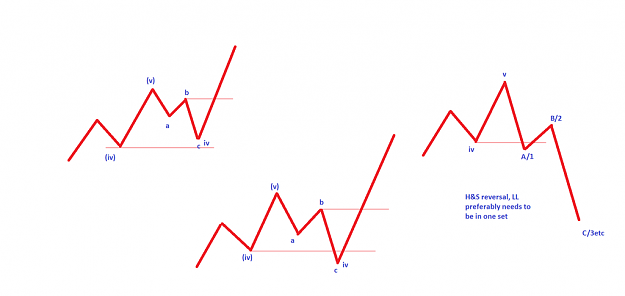
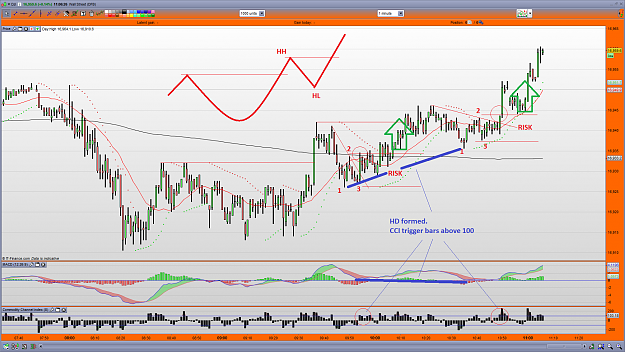
Firstly a Cup & Handle or Head & Shoulders set up, which can be either as trend change or trend continuation (after a pullback). I think it is self explanatory.
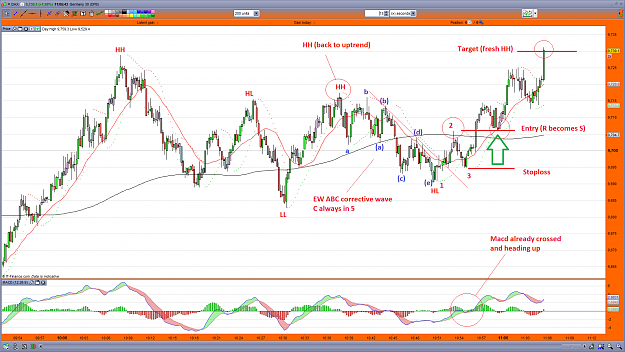
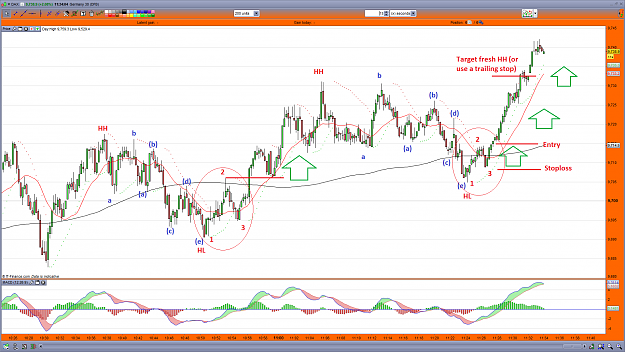
The second is a pullback within trend, followed by a 123 or a flagline, (but preferably both). The 123 can be used as entry back into trend. Looking for divergence in both instances will be important. Regular together with the first and Hidden divergence for trend continuation.

1) Determine a trend (HH/HL or LL/LH's)
2) Wait for a pullback
3) Enter back into main trend with a 123
4) Manage trade
GoFundMe -stage-4-glioma-brain-cancer-fighter (link in my profile)
  • Post #2
  • Quote
  • Mar 9, 2016 4:34am Mar 9, 2016 4:34am
  •  The Cableguy
  • Joined Apr 2011 | Status: NQ eta moi lybov... | 3,030 Posts
I'm going to run through a few set-up examples to show how it works in practice. Plan the trade - Trade the plan;

Attached Image (click to enlarge)
Click to Enlarge

Name: ftse07-03-16.png
Size: 138 KB


As above, but (obviously) in reverse.
Negative Divergence, followed by the last HL taken out in one direct channel, then a shallow pullback to form a flag off of a 123. Trigger is a break of point 2 by a full pip.


I say 'in one direct channel' (Wave A), because this is important. If it pulls back in a 3 wave sequence it is likely to be merely a pullback within trend already completed.

Attached Image (click to enlarge)
Click to Enlarge

Name: abc_zps2ypviiue.png
Size: 58 KB
GoFundMe -stage-4-glioma-brain-cancer-fighter (link in my profile)
2
  • Post #3
  • Quote
  • Mar 9, 2016 4:39am Mar 9, 2016 4:39am
  •  The Cableguy
  • Joined Apr 2011 | Status: NQ eta moi lybov... | 3,030 Posts
Just a pointer about Divergences. Regular Divergence is always over-ruled by Hidden Divergence and is something that must be looked for. Sometimes (by going peak to peak), it takes 2/3 bouts of Reg Div before it leads to more significant trend change. The point where we get a fresh High/Low is where Hidden Div can no longer form.

Here's an example;

Attached Image (click to enlarge)
Click to Enlarge

Name: eurusd1h04-03-16.png
Size: 166 KB
GoFundMe -stage-4-glioma-brain-cancer-fighter (link in my profile)
  • Post #4
  • Quote
  • Mar 9, 2016 5:05am Mar 9, 2016 5:05am
  •  The Cableguy
  • Joined Apr 2011 | Status: NQ eta moi lybov... | 3,030 Posts
I mentioned combining a couple of methods. I use Elliott Wave combined with Fib levels to confirm likely counts. If i can determine my likely preferred plan in advance, on a longer time scale, i can then drop to smaller timeframes to look for set-ups (pullbacks) within the overall plan to make the most of it.

Dow weekly (04-11-15);

Attached Image (click to enlarge)
Click to Enlarge

Name: dow1w04-11-15.png
Size: 228 KB


and recent (05-03-16);

Attached Image (click to enlarge)
Click to Enlarge

Name: doww05-03-16.png
Size: 132 KB


EU50STX 15min (29-02-16), here we have an abc pullback, Wave 'C' is always in 5 subwaves. subwave 'v' of 'C' was extended and was exactly 100% of waves 0-3, in itself an abcde expanding diagonal;

Attached Image (click to enlarge)
Click to Enlarge

Name: eu5015m29-02-16_1.png
Size: 217 KB


and later;

Attached Image (click to enlarge)
Click to Enlarge

Name: eu5015m29-02-16a_1.png
Size: 221 KB
GoFundMe -stage-4-glioma-brain-cancer-fighter (link in my profile)
  • Post #5
  • Quote
  • Mar 9, 2016 5:11am Mar 9, 2016 5:11am
  •  The Cableguy
  • Joined Apr 2011 | Status: NQ eta moi lybov... | 3,030 Posts
Looking for common Fib levels between wave counts.

Dax 1min chart (29-02-16), with a corrective abc move - wave 'C' was exactly 161.8% of wave 'A';

Attached Image (click to enlarge)
Click to Enlarge

Name: dax1m29-02-16_1.png
Size: 206 KB
GoFundMe -stage-4-glioma-brain-cancer-fighter (link in my profile)
  • Post #6
  • Quote
  • Mar 9, 2016 5:28am Mar 9, 2016 5:28am
  •  The Cableguy
  • Joined Apr 2011 | Status: NQ eta moi lybov... | 3,030 Posts
On the FTSE chart from a month ago, the daily looked like this;

Attached Image (click to enlarge)
Click to Enlarge

Name: ftsed11-02-16.png
Size: 221 KB


To me, it looked as though a cycle was complete with an abcde expanding diagonal. Just to confuse things, the market likes to disguise a further reaction off of the top channel line, but it wasn't fooling me. I expected a pullback and subsequent break out (as per chart).

Attached Image (click to enlarge)
Click to Enlarge

Name: ftsed03-03-16.png
Size: 167 KB


On the hourly, at the time of the first chart, i identified a possible top of 5w cycle, with wave 5 being exactly 61.8% of prior wave 3, this is 1 of the 3 most popular levels for a 5th wave to end;

Attached Image (click to enlarge)
Click to Enlarge

Name: ftse5w.png
Size: 165 KB


So i indicated a 3w corrective move to follow, but of course, i do not know whether this will be sharp, shallow, irregular, complex, simple etc.

Attached Image (click to enlarge)
Click to Enlarge

Name: ftase1h24-02-16.png
Size: 199 KB


What we actually got was an irregular move, (with wave 'B' making a fresh high). My evidence was that wave 'C' was exactly 161.8% of wave 'A'
GoFundMe -stage-4-glioma-brain-cancer-fighter (link in my profile)
1
  • Post #7
  • Quote
  • Edited at 2:57pm Mar 9, 2016 5:45am | Edited at 2:57pm
  •  The Cableguy
  • Joined Apr 2011 | Status: NQ eta moi lybov... | 3,030 Posts
One of my favourite combinations for a set-up is a simple abc move where we have a zigzag and wave 'c' is 100% of wave 'a, within parallel lines (Flag);

Attached Image (click to enlarge)
Click to Enlarge

Name: eurjpy123b_.png
Size: 189 KB


Look for the 123 to occur. Aggressive stop is above point 3.
GoFundMe -stage-4-glioma-brain-cancer-fighter (link in my profile)
  • Post #8
  • Quote
  • Mar 9, 2016 5:51am Mar 9, 2016 5:51am
  •  The Cableguy
  • Joined Apr 2011 | Status: NQ eta moi lybov... | 3,030 Posts
I do not claim to be a hotshot trader. I make mistakes all of the time. This is not a $1k to $10k in a month thread. Simply sharing and recording what works and what doesn't, but imo, the simplest method is too determine a trend by HH/HL (or LL/LH) combo's, look for a pullback and join the trend.

Attached Image (click to enlarge)
Click to Enlarge

Name: dow1m04-03-16.png
Size: 131 KB
GoFundMe -stage-4-glioma-brain-cancer-fighter (link in my profile)
  • Post #9
  • Quote
  • Mar 9, 2016 6:10am Mar 9, 2016 6:10am
  •  The Cableguy
  • Joined Apr 2011 | Status: NQ eta moi lybov... | 3,030 Posts
EurGbp weekly;

Attached Image (click to enlarge)
Click to Enlarge

Name: eurgbpw.png
Size: 167 KB


Complex move with Y = 123.6% of wave W and reaction at lower trendline.
GoFundMe -stage-4-glioma-brain-cancer-fighter (link in my profile)
  • Post #10
  • Quote
  • Mar 9, 2016 6:20am Mar 9, 2016 6:20am
  •  The Cableguy
  • Joined Apr 2011 | Status: NQ eta moi lybov... | 3,030 Posts
Now the move up from the low on the daily, (inc abcde ending diagonal);

Attached Image (click to enlarge)
Click to Enlarge

Name: eurgbpd.png
Size: 168 KB
GoFundMe -stage-4-glioma-brain-cancer-fighter (link in my profile)
  • Post #11
  • Quote
  • Mar 9, 2016 6:21am Mar 9, 2016 6:21am
  •  The Cableguy
  • Joined Apr 2011 | Status: NQ eta moi lybov... | 3,030 Posts
and now the current plan on the 4hr;

Attached Image (click to enlarge)
Click to Enlarge

Name: eurgbp4h09-03-16.png
Size: 260 KB
GoFundMe -stage-4-glioma-brain-cancer-fighter (link in my profile)
  • Post #12
  • Quote
  • Mar 9, 2016 6:49am Mar 9, 2016 6:49am
  •  The Cableguy
  • Joined Apr 2011 | Status: NQ eta moi lybov... | 3,030 Posts
Last night charts of Dax 1hr and S&P 2hr;

Attached Image (click to enlarge)
Click to Enlarge

Name: dax1h08-03-16.png
Size: 162 KB


Attached Image (click to enlarge)
Click to Enlarge

Name: S&P2h08-03-16.png
Size: 206 KB
GoFundMe -stage-4-glioma-brain-cancer-fighter (link in my profile)
  • Post #13
  • Quote
  • Mar 9, 2016 12:17pm Mar 9, 2016 12:17pm
  •  The Cableguy
  • Joined Apr 2011 | Status: NQ eta moi lybov... | 3,030 Posts
It's been a funny ole day. I committed the cardinal sin of going out and leaving a position, with only a stop in place. I did not have a set limit in mind. It was slightly underwater when i had to go out and i figured i would be back in time to deal with it... i wasn't, it was a winner, but i was delayed and came back to see it stopped out.

Anyway, i caught the Dow earlier. I will not attempt to label it's recent hourly moves, but the chop suggests naturally a complex move and thus i switch for looking at series of 3w moves. If an obvious fib relationship occurs between waves 'A' & 'C', it is likely to reverse;

Attached Image (click to enlarge)
Click to Enlarge

Name: dow3m09-03-16.png
Size: 133 KB


Here the two waves are equal to each other and PA reversed hard, once the last HL was taken out it was good to go.
GoFundMe -stage-4-glioma-brain-cancer-fighter (link in my profile)
  • Post #14
  • Quote
  • Mar 9, 2016 12:24pm Mar 9, 2016 12:24pm
  •  The Cableguy
  • Joined Apr 2011 | Status: NQ eta moi lybov... | 3,030 Posts
The UsdCad has provided some nice trending action recently, here i traded the simplest plan, pullback, 123, back to trend;

Attached Image (click to enlarge)
Click to Enlarge

Name: usdcad09-03-16.png
Size: 118 KB


The second set-up in the chart was most likely going to lead to Pos divergence, thus R:R only 1:1
GoFundMe -stage-4-glioma-brain-cancer-fighter (link in my profile)
  • Post #15
  • Quote
  • Mar 9, 2016 12:46pm Mar 9, 2016 12:46pm
  •  The Cableguy
  • Joined Apr 2011 | Status: NQ eta moi lybov... | 3,030 Posts
Earlier i posted a previous set-up on the EU50STX;

Attached Image (click to enlarge)
Click to Enlarge

Name: eu5015m29-02-16_1.png
Size: 217 KB


an abc pullback where within 'c' wave (v) was equal to waves '0'-'iii'

Now compare to the Dow a little earlier;

Attached Image (click to enlarge)
Click to Enlarge

Name: dow09-03-16.png
Size: 141 KB


The 'C' wave was a 5w move with crossover, thus an ending diagonal and again the final move (wave 'v') was exactly 100% of 'a-c'
GoFundMe -stage-4-glioma-brain-cancer-fighter (link in my profile)
  • Post #16
  • Quote
  • Mar 9, 2016 1:12pm Mar 9, 2016 1:12pm
  •  The Cableguy
  • Joined Apr 2011 | Status: NQ eta moi lybov... | 3,030 Posts
I find that 123's are best used when you are expecting them to occur, thus they become the excuse to take the trade and provide the stop placement.
Another place to expect them is at double tops or bottom's. This is from the FTSE earlier, although i missed it at the time;

Attached Image (click to enlarge)
Click to Enlarge

Name: ftsedt09-03-16.png
Size: 169 KB
GoFundMe -stage-4-glioma-brain-cancer-fighter (link in my profile)
  • Post #17
  • Quote
  • Edited at 3:00pm Mar 9, 2016 1:25pm | Edited at 3:00pm
  •  The Cableguy
  • Joined Apr 2011 | Status: NQ eta moi lybov... | 3,030 Posts
So basically we are talking about patterns that repeat themselves time and time again on all charts. It's simply a case of deciphering them.
The 123 gives you the chance to do any EW counts and prove/disprove the prior corrective move. The 123 should also preferably break out of any channel line created by either the entire corrective move, or at least the final wave (C);

Here are a couple of charts from the 15sec Dax. See the similarity to the above DOW&EU50 charts;

Attached Image (click to enlarge)
Click to Enlarge

Name: dax15s123.png
Size: 153 KB


HH/HL combo, abc corrective wave, then 123 and back to trend.

Same index and timescale a little later, see what happens again;

Attached Image (click to enlarge)
Click to Enlarge

Name: dax15s123a.png
Size: 124 KB
GoFundMe -stage-4-glioma-brain-cancer-fighter (link in my profile)
  • Post #18
  • Quote
  • Edited at 3:01pm Mar 9, 2016 1:52pm | Edited at 3:01pm
  •  The Cableguy
  • Joined Apr 2011 | Status: NQ eta moi lybov... | 3,030 Posts
Dow, wave 5 was equal to wave 3 (within 'C')

Attached Image (click to enlarge)
Click to Enlarge

Name: dow1m09-03-16.png
Size: 140 KB


Stoploss at +1
GoFundMe -stage-4-glioma-brain-cancer-fighter (link in my profile)
  • Post #19
  • Quote
  • Mar 9, 2016 2:15pm Mar 9, 2016 2:15pm
  •  The Cableguy
  • Joined Apr 2011 | Status: NQ eta moi lybov... | 3,030 Posts
Closed +50;

Attached Image (click to enlarge)
Click to Enlarge

Name: dow1m09-03-16a.png
Size: 140 KB
GoFundMe -stage-4-glioma-brain-cancer-fighter (link in my profile)
  • Post #20
  • Quote
  • Edited at 7:12am Mar 10, 2016 6:59am | Edited at 7:12am
  •  The Cableguy
  • Joined Apr 2011 | Status: NQ eta moi lybov... | 3,030 Posts
UsdCad; easiest to spot 5th waves - ending diagonals (contracting);

3 common targets for end of 5th wave;

a) 61.8% of waves 0-3
b) 61.8% of wave 3
c) 100% of wave 1 (usually if wave 3 was extended);

Attached Image (click to enlarge)
Click to Enlarge

Name: usdcad10-03-16.png
Size: 122 KB


Update;

Attached Image (click to enlarge)
Click to Enlarge

Name: usdcad10-03-16a.png
Size: 133 KB
GoFundMe -stage-4-glioma-brain-cancer-fighter (link in my profile)
  • Trading Journals
  • /
  • Plan the Trade
  • Reply to Thread
    • Page 1 23456 686
    • Page 1 2 686
0 traders viewing now
  • More
Top of Page
  • Facebook
  • Twitter
About FF
  • Mission
  • Products
  • User Guide
  • Media Kit
  • Blog
  • Contact
FF Products
  • Forums
  • Trades
  • Calendar
  • News
  • Market
  • Brokers
  • Trade Explorer
FF Website
  • Homepage
  • Search
  • Members
  • Report a Bug
Follow FF
  • Facebook
  • Twitter

FF Sister Sites:

  • Metals Mine
  • Energy EXCH
  • Crypto Craft

Forex Factory® is a brand of Fair Economy, Inc.

Terms of Service / ©2021