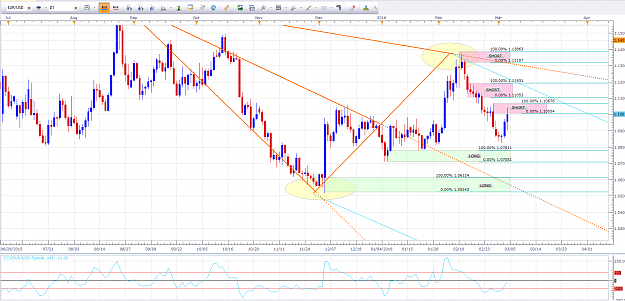
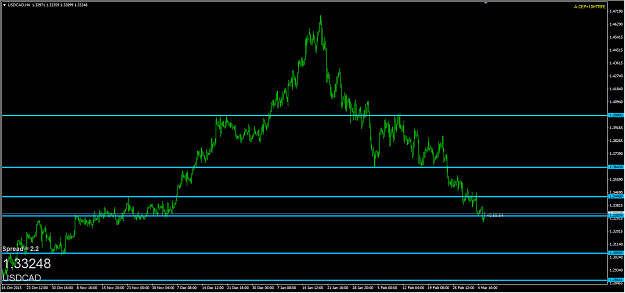
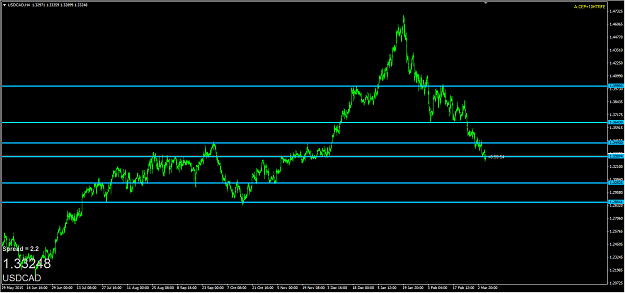
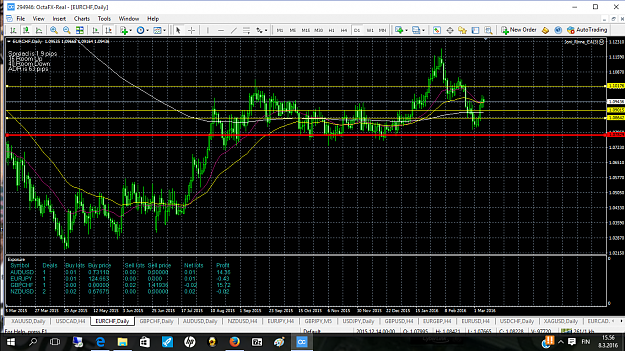
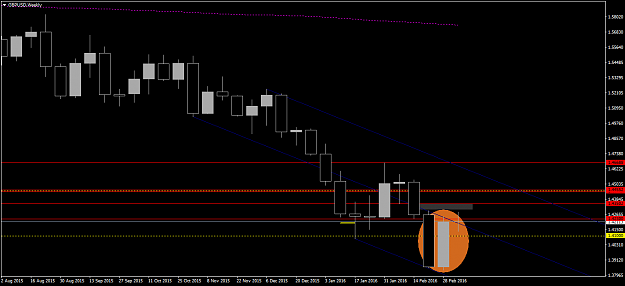
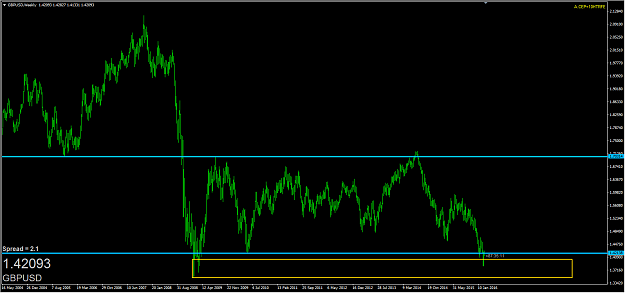
DislikedHere you see a linechart - EU weekly - linecharts in higher timeframes gives an extra clue for big turning points (TRENDCHANGE), remember that behind any level stands an "area" of S/R. If you switch then to bar /Candle charts in LTF you have a better overview , finding best levels as posible. Its nicely visible "123pattern" as randolf posted http://www.forexfactory.com/showthre...16#post8792416 this is just my experience over the years {image} trade well and nice weekend HPTIgnored
Attached Image (click to enlarge)
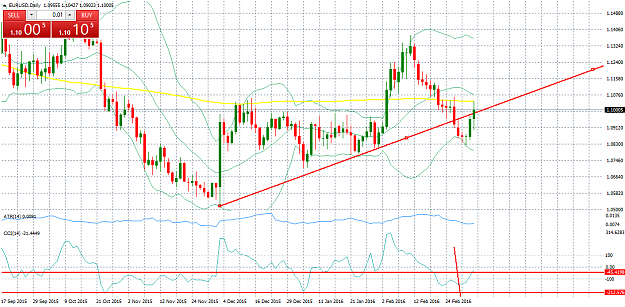
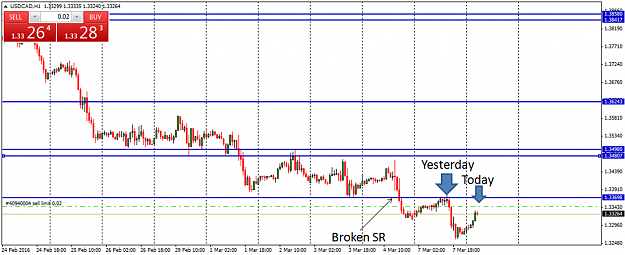
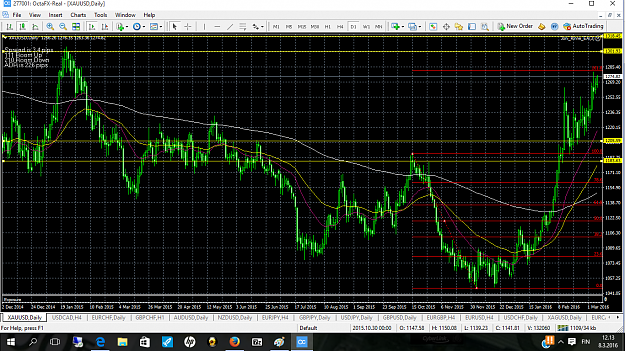
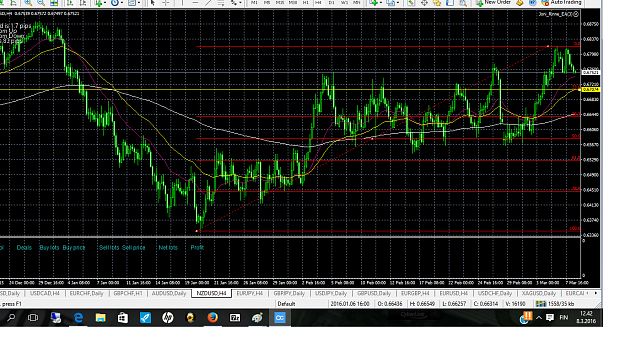
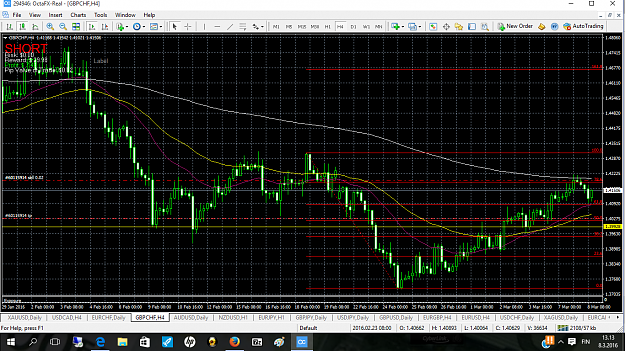
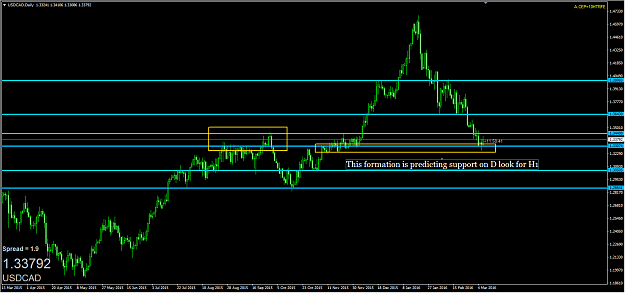
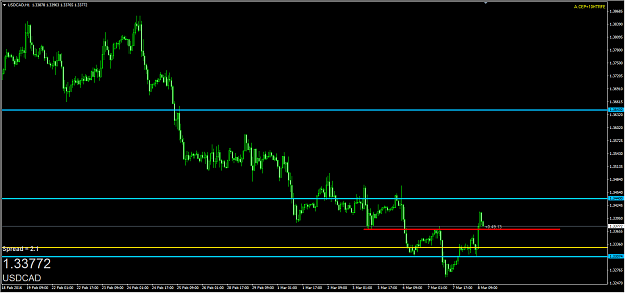
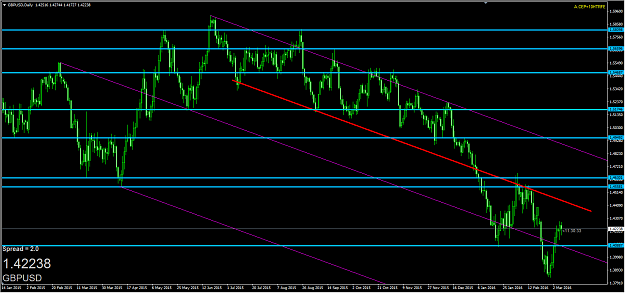
It broke down through its uptrend line last friday and bounced off off its 200 daily sma yesterday, both of those are bearish, I think it is going down next week.
The Trend Is Your Friend